GALLUP NEWS SERVICE
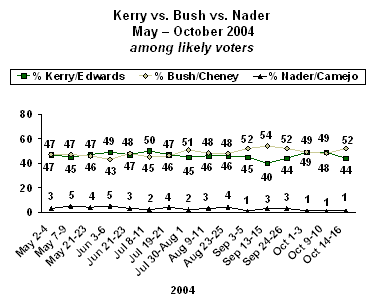
PRINCETON, NJ -- President George W. Bush has moved back ahead of Sen. John Kerry among likely voters in the latest CNN/USA Today/Gallup poll, essentially returning the race to where it was before the three presidential debates.
Among likely voters, Bush is ahead of Kerry by a 52% to 44% margin, exactly the same as in the last Gallup Poll conducted before the debates began in late September. Among registered voters, Bush has a 49% to 46% margin over Kerry.
Two CNN/USA Today/Gallup polls conducted during the debates indicated that Kerry had brought the race to a tie, and Americans clearly perceived that Kerry won each debate over Bush. Nevertheless, the current poll suggests that Kerry's perceived strong debate performance may have had only a temporary effect on the structure of the race. Kerry has now lost the edge he enjoyed among likely voters during the debate period, and Republicans have again become more enthusiastic than Democrats about their votes.
Despite the lead Bush has opened up nationally, the two candidates are essentially tied among likely voters in the 16 competitive showdown states in which the race for electoral votes is being fought. This suggests that some of Bush's current national gains may in essence be "lost" in states where the election outcome is fairly certain to be strongly for Bush or strongly for Kerry.
The Horse Race
The Oct. 14-16 CNN/USA Today/Gallup poll finds the shift toward Bush after last Wednesday night's debate is most pronounced among likely voters. Bush leads by a 49% to 46% margin among all registered voters, compared to a 48%-48% tie in the Oct. 9-10 poll. Among likely voters, Bush is now ahead by a 52% to 44% margin, compared to a 49% to 48% Kerry lead in the previous poll. (Ralph Nader gets just 1% of the vote among both groups.)
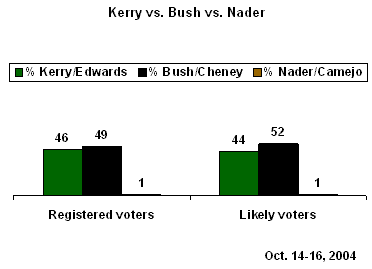
The race is, in essence, back where it was prior to the debates, when Bush had an identical 52% to 44% lead over Kerry among likely voters.
The Debates
The downtick in Kerry's positioning in the trial heat standings has occurred despite the fact that three consecutive surveys -- conducted after each of the presidential debates -- show that the general public widely perceived Kerry as having "won" the debates. (Even in the current survey in which Bush has the overall lead in the trial heat, voters say that Kerry won last Wednesday night's debate by a 46% to 32% margin.)
These data reinforce the conclusion that debate performance per se has rarely been highly correlated with abrupt or substantial shifts in the structures of presidential races. Even in years when it was widely accepted that a candidate had a poor debate (e.g., Gerald Ford in 1976 and Ronald Reagan in 1984), the debate loser either continued to gain on his challenger (Ford) or maintained his very significant lead (Reagan).
In the current situation, Kerry's perceived strong performance in the first debate on Sept. 30 in Miami did alter the race at that point, given that Gallup and other polls showed Kerry moving into a tie with Bush after having been behind in September. The current results, however, show that at least in the short term, the impact of the debates has apparently faded.
Regardless of which candidate you happen to support, who do you think did the better job in last Wednesday's debate -- [ROTATED: John Kerry (or) George W. Bush]?
|
|
|
|
BOTH EQUALLY (vol.) |
|
|
|
% |
% |
% |
% |
% |
|
|
3rd Presidential Debate |
|||||
|
2004 Oct 14-16 |
46 |
32 |
1 |
7 |
14 |
|
2nd Presidential Debate |
|||||
|
2004 Oct 9-10 ^ |
45 |
30 |
1 |
10 |
14 |
|
1st Presidential Debate |
|||||
|
2004 Oct 1-3 |
57 |
25 |
1 |
5 |
12 |
|
(vol.) Volunteered response |
|||||
|
^Asked of a half sample |
|||||
Showdown States?
The increase in support for Bush on a national level, of course, does not necessarily translate directly into support in the key swing states that are the primary focus of the campaign in its last two weeks.
In fact, the current poll shows that the competitive states remain just that -- very competitive. The race among likely voters in the 16 states that neither Bush nor Gore won by more than five points in 2000 has Bush with 47% of the vote compared to Kerry's 45%. That's virtually the same as the previous, Oct. 9-10, poll.
These findings suggest that the gains for Bush in the current poll have come primarily in the red and blue states that are highly likely to go for Bush and Kerry, respectively, and thus may not indicate an accelerating lead for Bush where it counts.
Does Bush Deserve to Be Re-Elected?
Fifty-three percent of likely voters now say that Bush "deserves to be re-elected," up from 48% in a mid-July poll. Although this number generally moves up and down in close relationship to the basic Bush versus Kerry ballot, it is an important separate indicator of an incumbent's chances for re-election when it is above 50%.
Please tell me whether you think each of the following political officeholders deserves to be re-elected, or not. How about -- ?
President Bush
|
Deserves |
Does not deserve |
No opinion |
|
|
% |
% |
% |
|
|
Likely Voters |
|||
|
2004 Oct 14-16 |
53 |
44 |
3 |
|
2004 Jul 19-21 |
48 |
50 |
2 |
|
Registered Voters |
|||
|
2004 Oct 14-16 |
50 |
47 |
3 |
|
2004 Jul 19-21 |
46 |
51 |
3 |
|
2003 Oct 10-12 |
53 |
45 |
2 |
|
2002 Sep 20-22 |
60 |
35 |
5 |
|
2002 Apr 29-May 1 |
69 |
25 |
6 |
|
2001 Aug 24-26 |
46 |
44 |
10 |
The Images of the Two Candidates
President Bush's image is now slightly more favorable than is Kerry's. Bush has a 55% favorable and 44% unfavorable rating in the Oct. 14-16 poll, while Kerry's rating is 52% favorable and 45% unfavorable.
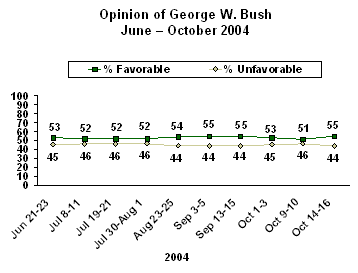
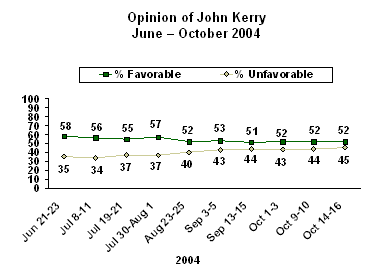
While these are not big differences, the change over the last week is clearly in Bush's direction. Bush had a net favorable rating (percent favorable minus percent unfavorable) of +5 after the second debate. Now, his net favorable rating has increased to +11.
Kerry, on the other hand, was at a +8 favorable rating after the second debate, but did not gain in this poll, and is now at +7. In other words, while Kerry's image was slightly more favorable than Bush's after the second debate, Bush's is more favorable than Kerry's now.
Bush's favorable rating has increased more significantly among likely voters, going from a 51%-47% (favorable to unfavorable) rating in the Oct. 9-10 poll to a 58%-41% rating in the latest poll. Kerry's image among likely voters, on the other hand, stayed virtually the same over the same period of time.
Next, we'd like to get your overall opinion of some people in the news. As I read each name, please say if you have a favorable or unfavorable opinion of these people -- or if you have never heard of them. First, ... How about ... ? [ITEMS A-B READ]
A. George W. Bush
|
|
|
Never |
No |
|
|
% |
% |
% |
% |
|
|
2004 Oct 14-16 (LV) |
58 |
41 |
* |
1 |
|
2004 Oct 9-10 (LV) |
51 |
47 |
-- |
2 |
|
2004 Oct 1-3 (LV) |
52 |
48 |
-- |
* |
B. John Kerry
|
|
|
Never |
No |
|
|
% |
% |
% |
% |
|
|
2004 Oct 14-16 (LV) |
51 |
47 |
-- |
2 |
|
2004 Oct 9-10 (LV) |
51 |
46 |
-- |
3 |
|
2004 Oct 1-3 (LV) |
54 |
44 |
* |
2 |
|
(LV) Likely voters |
||||
|
* Less than 0.5% |
||||
Additional Key Findings in the Poll:
1. Expectations About the Eventual Election Winner
When asked "Regardless of whom you support, and trying to be as objective as possible, who do you think will win the election in November -- John Kerry (or) George W. Bush?" Americans choose Bush by a 56% to 36% margin. That's a higher perception of a Bush victory than the two previous times this question has been asked by Gallup this year. The perception of a pending Bush victory is similar among registered and likely voters.
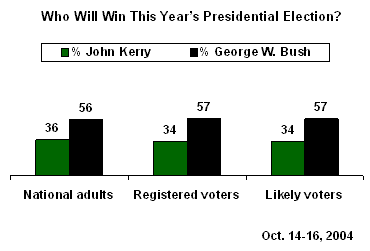
This is obviously a wider expectation spread than the actual horse-race vote would indicate, caused by the fact that 88% of Bush voters believe Bush will win, compared to only 67% of Kerry voters who believe Kerry will win. In other words, at this moment in time, Kerry voters are somewhat less confident that their candidate will prevail than is the case for Bush voters.
It is difficult to quantify the impact of this perception of who will win. Some observers argue that there is a "momentum" factor at work in elections, such that this perception may in turn have an impact on the actual vote. Yet, it is clear that the current feeling that Bush is going to win is not a reflection of recent public opinion polls. Over the last two weeks during the debate period, media coverage of polls has emphasized how close the race is.
2. Enthusiasm About Voting
Two-thirds of registered voters now say they are more enthusiastic about voting this year than they have been in previous elections. That compares to just 38% of voters who were more enthusiastic at the same point in October 2000, and only 17% who were more enthusiastic than usual in October 1996.
The poll finds that 88% of registered voters are paying quite a lot or some attention to this election, well above the mid-October readings of 73% and 71% in the last two presidential elections, and even above the 83% in the 1992 election -- when excitement had been generated by the third-party candidacy of maverick H. Ross Perot.
The most significant indicator of the increased salience of this year's election may come from the responses to this question:
Does the outcome of this year's presidential election matter to you more than in previous years, less than in previous years, or about the same?
|
Matters |
Matters |
Same |
No |
|
|
Likely Voters |
% |
% |
% |
% |
|
2004 Oct 14-16 |
75 |
1 |
24 |
-- |
|
2000 Oct 13-15 |
49 |
5 |
46 |
* |
|
Registered Voters |
||||
|
2004 Oct 14-16 |
72 |
2 |
26 |
-- |
|
2000 Oct 13-15 |
47 |
5 |
48 |
* |
|
1996 Oct 23-24 |
41 |
8 |
50 |
1 |
|
1996 Oct 22-23 |
44 |
6 |
49 |
1 |
|
1996 Oct 21-22 |
41 |
5 |
53 |
1 |
|
1996 Oct 20-21 |
39 |
5 |
55 |
1 |
|
* Less than 0.5% |
||||
|
|
||||
These data show the remarkable difference in significance attached to this election compared to previous years. More than 7 out of 10 registered voters this year say this election matters to them more than in previous years. That compares to just 47% who said this before the 2000 election, and roughly 40% who said it in mid-October 1996.
3. Republican Versus Democratic Enthusiasm
Seventy-seven percent of Republicans this year indicate that they are extremely or very enthusiastic about voting for president, compared to 65% of Democrats.
How enthusiastic would you say you are about voting for president in this year's election -- extremely enthusiastic, very enthusiastic, somewhat enthusiastic, not too enthusiastic, or not at all enthusiastic?
|
|
|
Somewhat |
Not |
Not |
No opinion |
||
|
% |
% |
% |
% |
% |
% |
||
|
Republicans/Republican Leaners |
|||||||
|
2004 Oct 14-16 |
35 |
42 |
15 |
6 |
2 |
* |
|
|
2004 Sep 3-5 † |
31 |
39 |
21 |
6 |
3 |
* |
|
|
2004 Aug 23-25 |
33 |
27 |
24 |
7 |
9 |
* |
|
|
2004 Jul 30-Aug 1 |
35 |
28 |
25 |
7 |
5 |
* |
|
|
2004 Jul 19-21 |
27 |
33 |
24 |
13 |
3 |
* |
|
|
2003 Oct 24-26 ^ |
19 |
39 |
32 |
7 |
2 |
1 |
|
|
Democrats/Democratic Leaners |
|||||||
|
2004 Oct 14-16 |
38 |
27 |
19 |
8 |
7 |
1 |
|
|
2004 Sep 3-5 † |
31 |
26 |
23 |
10 |
10 |
* |
|
|
2004 Aug 23-25 |
31 |
32 |
25 |
8 |
3 |
1 |
|
|
2004 Jul 30-Aug 1 |
33 |
32 |
22 |
8 |
5 |
* |
|
|
2004 Jul 19-21 |
26 |
31 |
21 |
13 |
7 |
2 |
|
|
2003 Oct 24-26 ^ |
19 |
29 |
31 |
16 |
5 |
* |
|
|
^ |
WORDING: How enthusiastic would you say you are about voting for president in next year's election -- extremely enthusiastic, very enthusiastic, somewhat enthusiastic, not too enthusiastic, or not at all enthusiastic? |
||||||
|
† |
BASED ON 250 REPUBLICANS OR REPUBLICAN LEANERS; ±7 PCT.
PTS. |
||||||
|
* Less than 0.5% |
|||||||
4. Swing Voters
The percentage of likely voters classified as "swing voters" in this poll is now at 11%, the lowest such percentage recorded this year.
Gallup defines swing voters as those who are undecided plus those who are leaning toward one candidate or the other, but say in response to a follow-up question that they may change their minds between now and the November election.
This swing voter number has been as high as 18% earlier in the year.
Swing voters are roughly evenly distributed between Kerry and Bush, suggesting that at this point, neither of the two major-party candidates has an edge among this vital group.
Additionally, the poll shows that there are no more nor less swing voters in the key showdown states than in either the red or blue states.
Are you certain now that you will vote for [John Kerry/George W. Bush/Ralph Nader] for president next fall, or do you think you may change your mind between now and the November election?
|
|
Vote for Kerry, may change mind |
|
Vote for Bush, may change mind |
|
Vote for Nader, may change mind |
|
|
|
|
Likely Voters |
% |
% |
% |
% |
% |
% |
% |
% |
|
2004 Oct 14-16 |
41 |
3 |
48 |
4 |
* |
* |
4 |
11 |
|
2004 Sep 24-26 ^ |
37 |
7 |
47 |
5 |
1 |
2 |
1 |
15 |
|
2004 Sep 3-5 |
40 |
5 |
48 |
4 |
NA |
NA |
3 |
12 |
|
2004 Aug 23-25 |
39 |
8 |
44 |
6 |
NA |
NA |
3 |
17 |
|
2004 Jul 30-Aug 1 |
42 |
5 |
46 |
5 |
NA |
NA |
2 |
12 |
|
2004 Jul 19-21 |
43 |
6 |
40 |
7 |
NA |
NA |
4 |
17 |
|
2004 May 21-23 |
42 |
7 |
40 |
7 |
NA |
NA |
4 |
18 |
|
2004 Mar 26-28 |
40 |
7 |
44 |
7 |
NA |
NA |
2 |
16 |
|
2004 Mar 5-7 |
45 |
7 |
38 |
6 |
NA |
NA |
4 |
17 |
5. Bush Job Approval Rating
President Bush's job approval rating has been hovering at about the 50% level since February of this year. His highest rating since that point was 54% in late September, and his lowest rating was 46% in May of this year -- signifying a remarkable constancy in this sometimes volatile measure of presidential performance.
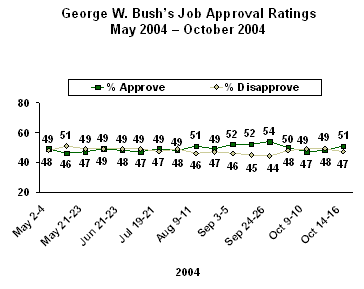
During the debate period, Bush's job approval rating dropped slightly, to readings of 47% and 48% in the previous two October Gallup Polls. But the current poll shows that Bush's job rating has moved up slightly again, to 51%.
This is not a statistically significant change, but the 50% job approval rating often takes on an important symbolic importance. The five most recent presidents to be re-elected (Bill Clinton, Reagan, Richard Nixon, Lyndon Johnson, and Dwight Eisenhower) had job approval ratings above 50% in the summer and/or fall of their election years -- in some cases well above. The only three presidents to lose their bids for re-election since Herbert Hoover (Ford, Jimmy Carter, and George H.W. Bush) had job approval ratings below 50%.
Survey Methods
These results are based on telephone interviews with a randomly selected national sample of 1,013 adults, aged 18 and older, conducted Oct. 14-16, 2004. For results based on this sample, one can say with 95% confidence that the maximum error attributable to sampling and other random effects is ±3 percentage points. In addition to sampling error, question wording and practical difficulties in conducting surveys can introduce error or bias into the findings of public opinion polls.
Results based on likely voters are based on the subsample of 788 survey respondents deemed most likely to vote in the November 2004 general election, according to a series of questions measuring current voting intentions and past voting behavior. For results based on the total sample of likely voters, one can say with 95% confidence that the maximum margin of sampling error is ±4 percentage points. The likely voter model assumes a turnout of 55% of national adults. The "likely voter" sample is weighted down to match this assumption.
For results based on the sample of 942 registered voters, the maximum margin of sampling error is ±4 percentage points.
