GALLUP NEWS SERVICE
PRINCETON, NJ -- The annual Gallup survey on trust in government, conducted Sept. 13-15, finds little change from last year in the degree of trust expressed by the American people. A clear majority says they have either "a great deal" or "fair amount" of trust in the government to deal with international and domestic problems. Clear majorities also say they have a great deal or fair amount of trust and confidence in the three branches of government, their state and local governments, in the men and women in political life who are either holding or running for office, and in the American people as a whole. Less than a majority of Americans express a high level of trust in the "fourth branch" of government -- the mass media.
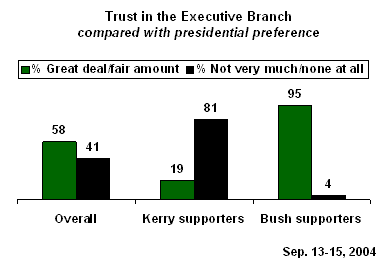
The poll also finds that trust in the executive branch of government, and in the ability of the government to deal with international and domestic problems, is highly related to Americans' presidential preference. People who voted for President George W. Bush expressed higher trust than people who supported Sen. John Kerry.
Trends in Trust
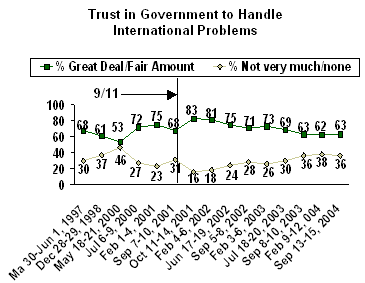
Trust in the government's ability to handle both international and domestic problems surged dramatically after the Sept. 11 terrorist attacks. In October 2001, 83% of Americans said they had either a great deal or fair amount of trust in the government's ability to handle international problems. The percentage expressing that viewpoint declined gradually over the next three years and has now returned to its pre-9/11 levels. In fact, high trust in the government to handle international affairs (63%) is significantly lower now than when Bush first entered office (75%).
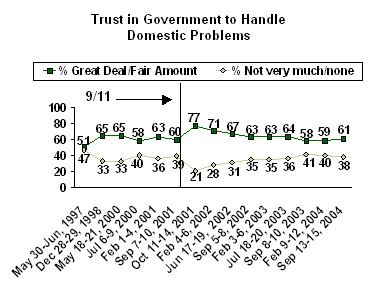
Trust in the government to handle domestic problems jumped from 60% to 77% right after 9/11, and now is back down to the pre-9/11 level at 61%.
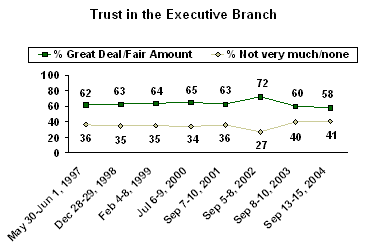
Trust in the executive branch has remained relatively steady over the past several years, except for a bump that occurred the year after 9/11 (only annual measures have been taken on this item). Just before the terrorist attacks in 2001, 63% of Americans expressed a high level of trust, but the next September 72% expressed that view. In 2003, trust had returned to 60%, and is now at 58%.
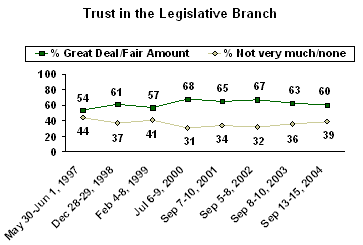
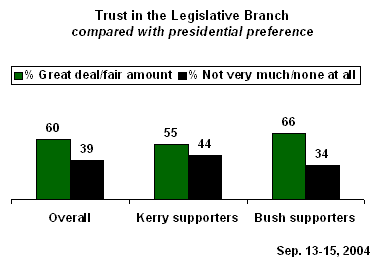
If there was a bump in trust in the legislative branch following 9/11, it had all but disappeared by the following year. In the Sept. 7-10, 2001 poll, 65% expressed high trust, compared with 67% a year later.
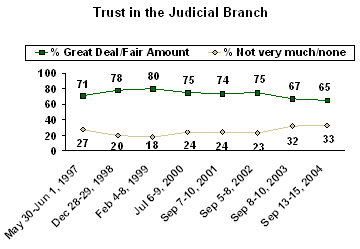
Trust in the judicial branch, including the Supreme Court, has traditionally been higher than trust in the other two branches. In the past two years, however, trust in the judicial branch has dipped below the 70% level.
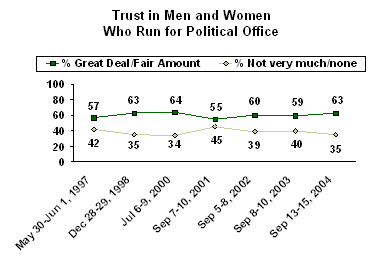
Trust in the men and women who run for or hold political office has remained steady over the past seven years, with the low point occurring right before 9/11.
Trust Related to Presidential Preference
The poll shows specific areas where trust in government is highly related to people's partisan orientation. The most salient partisan orientation in 2004 has been those who supported Bush for re-election, and those who supported Kerry.
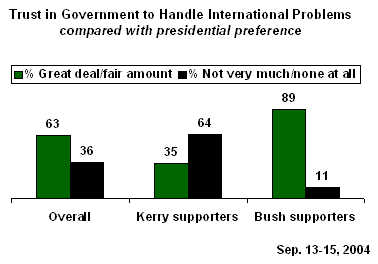
Overall, 63% of Americans express high trust and 36% express low trust in the ability of government to deal with international affairs. But Kerry supporters are more likely to express low trust than high trust, by 64% to 35%. Bush supporters overwhelmingly disagree -- with 89% expressing high trust and only 11% low trust.
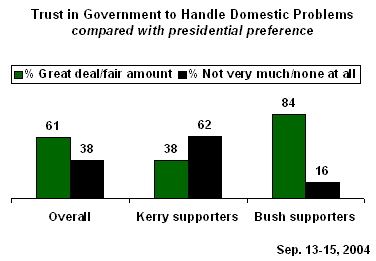
A similar pattern is found in the rating of the government's ability to deal with domestic problems. Kerry supporters give a net low rating (62% vs. 38% high rating), while again Bush supporters are overwhelmingly more positive -- 84% high trust, 16% low trust.
Not surprisingly, the most dramatic differences between the two groups of supporters are found in their trust and confidence in the executive branch -- headed by Bush. Only 19% of Kerry supporters express high trust, compared with 95% of Bush supporters.
Though Republicans control both houses of the legislative branch (the U.S. House and the U.S. Senate), the differences in trust ratings between the Kerry and Bush supporters are rather small. Majorities of both groups express high confidence -- 55% of Kerry supporters and 66% of Bush supporters.
There are also only small differences between Bush and Kerry supporters in their ratings of the judicial branch, and their ratings of men and women who run for or hold office.
Survey Methods
Results are based on telephone interviews with 1,022 national adults, aged 18 and older, conducted Sept. 13-15, 2004. For results based on the total sample of national adults, one can say with 95% confidence that the maximum margin of sampling error is ±3 percentage points. In addition to sampling error, question wording and practical difficulties in conducting surveys can introduce error or bias into the findings of public opinion polls.
16. Now I'd like to ask you several questions about our governmental system. First, how much trust and confidence do you have in our federal government in Washington when it comes to handling [Read A-B] -- a great deal, a fair amount, not very much, or none at all?
A. International Problems
|
Great |
Fair |
Not very |
None |
No |
|
|
% |
% |
% |
% |
% |
|
|
2004 Sep 13-15 |
18 |
45 |
28 |
8 |
1 |
|
|
|
|
|
|
|
|
2004 Feb 9-12 |
14 |
48 |
29 |
9 |
* |
|
2003 Sep 8-10 |
16 |
47 |
27 |
9 |
1 |
|
2003 Jul 18-20 |
17 |
52 |
25 |
5 |
1 |
|
2003 Feb 3-6 |
17 |
56 |
20 |
6 |
1 |
|
2002 Sep 5-8 |
18 |
53 |
22 |
6 |
1 |
|
2002 Jun 17-19 |
21 |
54 |
18 |
6 |
1 |
|
2002 Feb 4-6 |
21 |
60 |
14 |
4 |
1 |
|
2001 Oct 11-14 |
36 |
47 |
13 |
3 |
1 |
|
2001 Sep 7-10 |
14 |
54 |
25 |
6 |
1 |
|
2001 Feb 1-4 |
12 |
63 |
19 |
4 |
2 |
|
2000 Jul 6-9 |
17 |
55 |
21 |
6 |
1 |
|
2000 May 18-21 |
8 |
45 |
34 |
12 |
1 |
|
1998 Dec 28-29 |
9 |
52 |
30 |
7 |
2 |
|
1997 May 30-Jun 1 |
10 |
58 |
23 |
7 |
2 |
|
1976 Jun |
8 |
48 |
33 |
7 |
4 |
|
1974 Apr |
24 |
49 |
18 |
4 |
3 |
|
1972 May |
20 |
55 |
20 |
2 |
4 |
|
* Less than 0.5% |
|||||
B. Domestic Problems
|
Great |
Fair |
Not very |
None |
No |
|
|
% |
% |
% |
% |
% |
|
|
2004 Sep 13-15 |
13 |
48 |
31 |
7 |
1 |
|
|
|
|
|
|
|
|
2004 Feb 9-12 |
9 |
50 |
30 |
10 |
1 |
|
2003 Sep 8-10 |
9 |
49 |
32 |
9 |
1 |
|
2003 Jul 18-20 |
14 |
50 |
29 |
7 |
* |
|
2003 Feb 3-6 |
11 |
52 |
28 |
7 |
2 |
|
2002 Sep 5-8 |
11 |
52 |
28 |
7 |
2 |
|
2002 Jun 17-19 |
13 |
54 |
23 |
8 |
2 |
|
2002 Feb 4-6 |
12 |
59 |
23 |
5 |
1 |
|
2001 Oct 11-14 |
24 |
53 |
17 |
4 |
2 |
|
2001 Sep 7-10 |
6 |
54 |
31 |
8 |
1 |
|
2001 Feb 1-4 |
7 |
56 |
28 |
8 |
1 |
|
2000 Jul 6-9 |
10 |
48 |
30 |
10 |
2 |
|
2000 May 18-21 |
11 |
54 |
26 |
7 |
2 |
|
1998 Dec 28-29 |
11 |
54 |
26 |
7 |
2 |
|
1997 May 30-Jun 1 |
6 |
45 |
36 |
11 |
2 |
|
1976 Jun |
5 |
44 |
42 |
7 |
3 |
|
1974 Apr |
9 |
42 |
36 |
8 |
4 |
|
1972 May |
11 |
59 |
26 |
3 |
2 |
|
* Less than 0.5% |
|||||
17. As you know, our federal government is made up of three branches: an Executive branch, headed by the President: a Judicial branch, headed by the U.S. Supreme Court: and a Legislative branch, made up of the U.S. Senate and House of Representatives. First, let me ask you how much trust and confidence you have at this time in the Executive branch headed by the President, the Judicial branch headed by the U.S. Supreme Court, and the Legislative branch, consisting of the U.S. Senate and House of Representatives -- a great deal, a fair amount, not very much, or none at all?
A. The Executive branch headed by the President
|
Great |
Fair |
Not very |
None |
No |
|
|
% |
% |
% |
% |
% |
|
|
2004 Sep 13-15 |
31 |
27 |
25 |
16 |
1 |
|
2003 Sep 8-10 |
25 |
35 |
26 |
14 |
* |
|
2002 Sep 5-8 |
28 |
44 |
20 |
7 |
1 |
|
2001 Sep 7-10 |
21 |
42 |
28 |
8 |
1 |
|
2000 Jul 6-9 |
18 |
47 |
23 |
11 |
1 |
|
1999 Feb 4-8 |
21 |
43 |
24 |
11 |
1 |
|
1998 Dec 28-29 |
24 |
39 |
23 |
12 |
2 |
|
1997 May 30-Jun 1 |
13 |
49 |
27 |
9 |
2 |
|
1976 Jun |
13 |
45 |
30 |
9 |
4 |
|
1974 Apr |
12 |
28 |
36 |
20 |
3 |
|
1972 May |
24 |
49 |
20 |
4 |
2 |
|
* Less than 0.5% |
|||||
B. The Judicial branch, headed by the U.S. Supreme Court
|
Great |
Fair |
Not very |
None |
No |
|
|
% |
% |
% |
% |
% |
|
|
2004 Sep 13-15 |
14 |
51 |
27 |
6 |
2 |
|
2003 Sep 8-10 |
13 |
54 |
27 |
5 |
1 |
|
2002 Sep 5-8 |
17 |
58 |
18 |
5 |
2 |
|
2001 Sep 7-10 |
17 |
57 |
20 |
4 |
2 |
|
2000 Jul 6-9 |
23 |
52 |
18 |
6 |
1 |
|
1999 Feb 4-8 |
29 |
51 |
13 |
5 |
2 |
|
1998 Dec 28-29 |
27 |
51 |
16 |
4 |
2 |
|
1997 May 30-Jun 1 |
19 |
52 |
22 |
5 |
2 |
|
1976 Jun |
16 |
47 |
26 |
6 |
4 |
|
1974 Apr |
17 |
54 |
20 |
5 |
5 |
|
1972 May |
17 |
49 |
24 |
7 |
4 |
C. The Legislative branch, consisting of the U.S. Senate and House of Representatives
|
Great |
Fair |
Not very |
None |
No |
|
|
% |
% |
% |
% |
% |
|
|
2004 Sep 13-15 |
7 |
53 |
33 |
6 |
1 |
|
2003 Sep 8-10 |
8 |
55 |
31 |
5 |
1 |
|
2002 Sep 5-8 |
9 |
58 |
26 |
6 |
1 |
|
2001 Sep 7-10 |
7 |
58 |
28 |
6 |
1 |
|
2000 Jul 6-9 |
11 |
57 |
24 |
7 |
1 |
|
1999 Feb 4-8 |
8 |
49 |
34 |
7 |
2 |
|
1998 Dec 28-29 |
13 |
48 |
30 |
7 |
2 |
|
1997 May 30-Jun 1 |
6 |
48 |
36 |
8 |
2 |
|
1976 Jun |
9 |
52 |
31 |
6 |
4 |
|
1974 Apr |
13 |
55 |
24 |
4 |
4 |
|
1972 May |
13 |
58 |
22 |
3 |
3 |
18. How much trust and confidence do you have in the government of the state where you live when it comes to handling state problems -- a great deal, a fair amount, not very much, or none at all?
|
Great |
Fair |
Not very |
None |
No |
|
|
% |
% |
% |
% |
% |
|
|
2004 Sep 13-15 |
16 |
51 |
24 |
8 |
1 |
|
|
|
|
|
|
|
|
2003 Sep 8-10 |
12 |
41 |
34 |
12 |
1 |
|
2001 Sep 7-10 |
17 |
48 |
27 |
7 |
1 |
|
1998 Dec 28-29 |
29 |
51 |
15 |
4 |
1 |
|
1997 May 30-Jun 1 |
18 |
50 |
25 |
6 |
1 |
|
1976 Jun |
13 |
59 |
19 |
7 |
2 |
|
1974 Apr |
16 |
59 |
17 |
3 |
4 |
|
1972 May |
15 |
48 |
27 |
6 |
3 |
19. And how much trust and confidence do you have in the local governments in the area where you live when it comes to handling local problems -- a great deal, a fair amount, not very much, or none at all?
|
Great |
Fair |
Not very |
None |
No |
|
|
% |
% |
% |
% |
% |
|
|
2004 Sep 13-15 |
21 |
47 |
24 |
7 |
1 |
|
|
|
|
|
|
|
|
2003 Sep 8-10 |
18 |
50 |
23 |
8 |
1 |
|
2001 Sep 7-10 |
19 |
50 |
20 |
10 |
1 |
|
1998 Dec 28-29 |
23 |
54 |
16 |
5 |
2 |
|
1997 May 30-Jun 1 |
21 |
48 |
21 |
7 |
2 |
|
1976 Jun |
13 |
52 |
23 |
9 |
3 |
|
1974 Apr |
16 |
55 |
16 |
8 |
5 |
|
1972 May |
12 |
51 |
26 |
7 |
4 |
20. In general, how much trust and confidence do you have in the mass media -- such as newspapers, T.V. and radio -- when it comes to reporting the news fully, accurately, and fairly -- a great deal, a fair amount, not very much, or none at all?
|
Great |
Fair |
Not very |
None |
No |
|
|
% |
% |
% |
% |
% |
|
|
2004 Sep 13-15 |
9 |
35 |
39 |
16 |
1 |
|
|
|
|
|
|
|
|
2003 Sep 8-10 |
14 |
40 |
35 |
11 |
* |
|
2002 Sep 5-8 |
10 |
44 |
35 |
11 |
* |
|
2001 Sep 7-10 |
12 |
41 |
33 |
14 |
* |
|
2000 Jul 6-9 |
12 |
39 |
37 |
12 |
* |
|
1999 Feb 4-8 |
11 |
44 |
34 |
11 |
* |
|
1998 Dec 28-29 |
11 |
44 |
35 |
9 |
1 |
|
1997 May 30-Jun 1 |
10 |
43 |
31 |
15 |
1 |
|
1976 Jun |
18 |
54 |
22 |
4 |
2 |
|
1974 Apr |
21 |
48 |
21 |
8 |
2 |
|
1972 May |
18 |
50 |
24 |
6 |
2 |
|
* Less than 0.5% |
|||||
21. How much trust and confidence do you have in general in men and women in political life in this country who either hold or are running for public office -- a great deal, a fair amount, not very much, or none at all?
|
Great |
Fair |
Not very |
None |
No |
||
|
% |
% |
% |
% |
% |
||
|
2004 Sep 13-15 |
6 |
57 |
32 |
3 |
2 |
|
|
|
|
|
|
|
||
|
2003 Sep 8-10 |
5 |
54 |
36 |
4 |
1 |
|
|
2002 Sep 5-8 |
6 |
54 |
33 |
6 |
1 |
|
|
2001 Sep 7-10 ^ |
4 |
51 |
39 |
6 |
* |
|
|
2000 Jul 6-9 |
7 |
57 |
31 |
3 |
2 |
|
|
1998 Dec 28-29 |
7 |
56 |
31 |
4 |
2 |
|
|
1997 May 30-Jun 1 |
5 |
52 |
37 |
5 |
1 |
|
|
1976 Jun |
6 |
58 |
28 |
4 |
4 |
|
|
1974 Apr |
7 |
61 |
24 |
4 |
4 |
|
|
1972 May |
7 |
58 |
27 |
5 |
2 |
|
|
* Less than 0.5% |
||||||
|
^ |
Asked of a half sample. |
|||||
22. More generally, how much trust and confidence do you have in the American people as a whole when it comes to making judgments under our democratic system about the issues facing our country -- a great deal, a fair amount, not very much, or none at all?
|
Great |
Fair |
Not very |
None |
No |
|
|
% |
% |
% |
% |
% |
|
|
2004 Sep 13-15 |
21 |
54 |
22 |
2 |
1 |
|
|
|
|
|
|
|
|
2003 Sep 8-10 |
24 |
52 |
21 |
2 |
1 |
|
2002 Sep 5-8 |
23 |
55 |
17 |
4 |
1 |
|
2001 Sep 7-10 |
17 |
57 |
22 |
3 |
1 |
|
1976 Jun |
25 |
61 |
12 |
1 |
2 |
|
1974 Apr |
27 |
56 |
13 |
2 |
3 |
