The United States is not the only country with healthcare woes. Given the United States' predominantly private healthcare system, it's foreseeable that escalating costs will continue to drive up insurance premiums and cause the ranks of uninsured Americans to swell. In Canada and Great Britain, where healthcare is universally available to everyone, the most common problems are different but no less troubling. Waiting lists for medical procedures in these two countries are long, and Canadians and Britons may wait for months -- or even years -- for non-emergency surgeries such as knee replacements.
How do residents in each country feel about their healthcare systems? Data from three recent Gallup Polls conducted in the United States, Canada, and Great Britain* suggest feelings are mixed in all three countries, although Americans are more likely than Canadians and Britons to give "excellent" ratings both to the quality of the country's healthcare system as a whole and to the healthcare they personally receive.
Canadians, Britons Less Enthusiastic About Healthcare
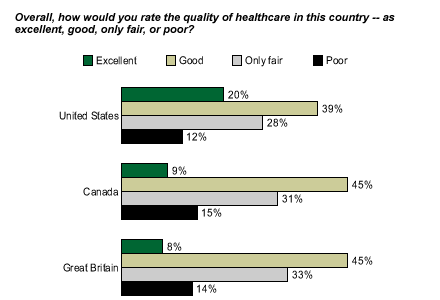
When asked to rate the quality of healthcare in their country, 20% of Americans say "excellent," compared with 9% of Canadians and 8% of Britons. Respondents in Canada and Great Britain are slightly more likely to rate healthcare in their countries as "good" (45% in each country) than are Americans (39%). Roughly a third of respondents in each country rate their healthcare system as "only fair" (28% in the United States, 31% in Canada, and 33% in Great Britain), while 12% of Americans, 15% of Canadians, and 14% of Britons rate the healthcare in their countries as "poor."

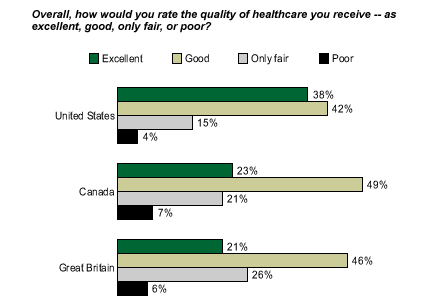
The same pattern emerges when people in each country are asked to rate the quality of healthcare they personally receive. Across the board, excellent ratings of the healthcare people receive are higher than excellent ratings of overall healthcare, reflecting a common phenomenon Gallup calls "better in my back yard." Thirty-eight percent of Americans rate the healthcare they receive as excellent, as do 23% of Canadians and 21% of Britons. The corresponding "good" percentages are 42%, 49%, and 46%, respectively. Fifteen percent of U.S. adults, 21% of Canadian adults, and 26% of British adults rate their personal healthcare as only fair, and the corresponding "poor" percentages are 4%, 7%, and 6%, respectively.

Americans Visit Doctor More
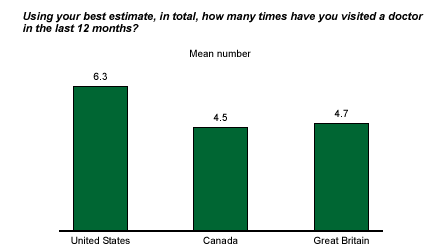
Gallup data show that Americans visit the doctor more often on average than do Canadians or Britons. Gallup asked residents of each country how many times they have visited a doctor in the past 12 months. Americans went to the doctor an average of 6.3 times, while Canadians went 4.5 times and Britons went 4.7 times. Among other things, the higher number of doctor visits in the United States could relate to the fact that many U.S. HMOs require patients to visit their primary care physician for a referral before visiting a specialist.

Bottom Line
Why do Americans give higher ratings to their healthcare system and visit the doctor more often than Canadians and Britons do? There are many potential explanations, but one possibility is that the universal healthcare systems in Canada and Great Britain leave patients feeling like they have less control over their healthcare destinies. The long waiting periods for medical treatment that Canadians and Britons often face may also be a factor. As Deborah Toto, a Gallup healthcare expert, says, "Americans have greater access and choices for healthcare providers. Americans perceive healthcare to be higher quality than Brits and Canadians because they are more likely to be satisfied with their own choices."
*Results in the United States are based on telephone interviews with 1,016 national adults, aged 18 and older, conducted Nov. 7-10, 2004. For results based on the total sample of national adults, one can say with 95% confidence that the maximum margin of sampling error is ±3 percentage points. The survey was conducted by Gallup USA.
Results in Canada are based on telephone interviews with 1,004 national adults, aged 18 and older, conducted Dec. 6-12, 2004. For results based on the total sample of national adults, one can say with 95% confidence that the maximum margin of sampling error is ±3 percentage points. The survey was conducted by Gallup Canada.
Results in Great Britain are based on telephone interviews with 1,009 national adults, aged 18 and older, conducted Dec. 1-21, 2004. For results based on the total sample of national adults, one can say with 95% confidence that the maximum margin of sampling error is ±5 percentage points. The survey was conducted by Gallup UK.