GALLUP NEWS SERVICE
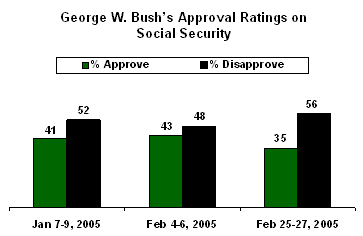
PRINCETON, NJ -- George W. Bush's ratings for handling Social Security have dropped in recent weeks, and now a majority of Americans disapprove of the way he is handling that issue. Additionally, as debate on the Social Security system has intensified, Americans now perceive less urgency for reform: fewer say major changes are needed to the system within the next two years than did so in January. The public is divided over whether the greater risk is to take a private investment approach to Social Security reform or rely on the current system to pay full benefits when workers retire. Bush's overall job approval rating is holding steady at 52%.
According to the Feb. 25-27 CNN/USA Today/Gallup poll, 35% of Americans approve and 56% disapprove of the way Bush is handling the issue of Social Security. That compares with a 43% approval rating immediately following the State of the Union address, in which Bush made the case for significant reforms to the system. So far this year, Bush has failed to gain majority public support for his approach to the Social Security issue.
At this point, the poll finds Americans more inclined to say they trust the Democratic Party (47%) than the Republican Party (37%) when it comes to handling the issue of Social Security retirement benefits.
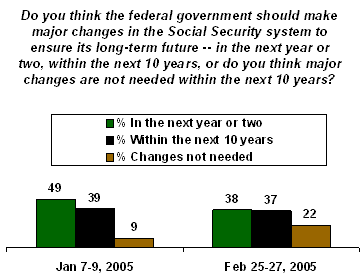
Americans now show a diminished sense of urgency to reform the Social Security system when compared to earlier this year. A Jan. 7-9 poll found just under half of Americans, 49%, saying that "the federal government should make major changes in the Social Security system" in the next year or two "to ensure its long-term future." Thirty-nine percent said the federal government should make major changes within the next 10 years, and only 9% said major changes were not needed within the next 10 years. Now, 38% say action needs to be taken in the short term, 37% in the longer term, and 22% say not at all.
This change may be due to the fact that the Social Security issue has come into sharper focus nationally. As a result, it has become more partisan in nature, with Bush and the Republicans tending to favor a more aggressive approach to reform while the Democrats favor a more measured approach. Americans today tend to see the issue in Republican and Democratic terms, and adopt a position more in line with that of their preferred party. In fact, the data show most of the change regarding the urgency for more immediate reform coming among Democrats.
|
Perceived Need for Major Changes |
|||||||||
|
Jan 7-9 |
|
Feb 25-27 |
|||||||
|
|
|
|
|
|
|
|
|||
|
Dem |
Ind |
Rep |
|
Dem |
Ind |
Rep |
|||
|
% |
% |
% |
|
% |
% |
% |
|||
|
Changes needed in 1-2 years |
53 |
48 |
45 |
|
33 |
41 |
40 |
||
|
Changes needed within 10 years |
35 |
39 |
45 |
|
31 |
32 |
47 |
||
|
Changes not needed within next 10 years |
11 |
8 |
8 |
|
34 |
23 |
9 |
||
In January, a majority of Democrats, 53%, said major changes were needed in the next two years and only 11% said they were not needed within the next 10 years. Now, Democrats are three times more likely to say major changes are not needed in the next 10 years (34%) and significantly less likely to believe major changes are needed during this session of Congress (33%). Independents are also now more likely to believe no major changes are needed (23%) than they were in January (8%). Republicans' views have changed relatively little in the last two months.
Shifting opinions on the perceived need for changes to the Social Security system are also apparent by age. Americans aged 50 and older are much less likely now than in January to favor major changes in the next two years. In January, the plurality of members of this age group said such changes were needed in the next two years and only 13% said major changes were not needed in the next 10 years. Now, 29% say major changes are not needed and only 27% believe changes are needed in the next two years.
|
Perceived Need for Major Changes |
|||||||
|
Jan 7-9 |
|
Feb 25-27 |
|||||
|
|
|
|
|
|
|||
|
18-49 |
50+ |
|
18-49 |
50+ |
|||
|
% |
% |
|
% |
% |
|||
|
Changes needed in 1-2 years |
53 |
45 |
|
45 |
27 |
||
|
Changes needed within 10 years |
40 |
38 |
|
36 |
40 |
||
|
Changes not needed within next 10 years |
7 |
13 |
|
16 |
29 |
||
Clearly, the private investment approach to reforming Social Security -- long championed by Bush -- entails risks. While that approach holds out the promise of paying higher benefits when workers retire, it also could result in significantly lower benefits if the investments do not pan out. The public is divided as to whether that risk is greater for the average worker than the risk involved in relying on the system to pay the current level of benefits. Forty-six percent perceive private investment to be the greater risk, while 50% say relying on the system to pay the current level of benefits is riskier. These perceptions are generally similar by subgroup, though Democrats tend to see private investment as riskier and Republicans are more likely to believe that relying on the current system to pay benefits is the more risky approach.
Bush's Ratings
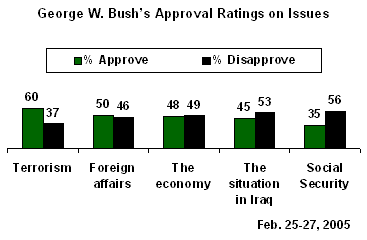
Social Security is the issue on which Bush receives the lowest ratings of the five tested in the poll. Sixty percent approve of the way he is handling terrorism, and half give him passing marks on foreign affairs. This last figure is unchanged following Bush's European trip last week.
The public is divided on Bush's handling of the economy, with 48% approving and 49% disapproving. And Americans disapprove rather than approve of Bush's handling of Iraq by a 53% to 45% margin.
Bush's overall job approval rating of 52% is right in line with the most recent measurements (49% in a Feb. 7-10 poll and 51% in a Feb. 21-24 poll), after showing a temporary increase to 57% immediately following the State of the Union address and the Iraqi elections.
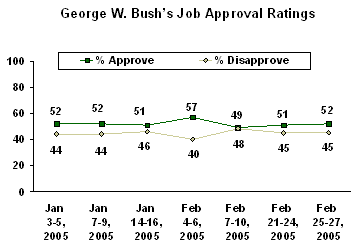
In fact, aside from that recent 57% rating and a slightly higher rating in November following his re-election victory, Bush's approval rating has hovered around the 50% mark since January 2004.
Survey Methods
These results are based on telephone interviews with a randomly selected national sample of 1,008 adults, aged 18 and older, conducted Feb. 25-27, 2005. For results based on this sample, one can say with 95% confidence that the maximum error attributable to sampling and other random effects is ±3 percentage points. For results based on the 526 national adults in the Form A half-sample and 482 national adults in the Form B half-sample, the maximum margins of sampling error are ±5 percentage points. In addition to sampling error, question wording and practical difficulties in conducting surveys can introduce error or bias into the findings of public opinion polls.
1. Do you approve or disapprove of the way George W. Bush is handling his job as president?
|
|
Approve |
Disapprove |
No opinion |
|
% |
% |
% |
|
|
2005 |
|
|
|
|
2005 Feb 25-27 |
52 |
45 |
3 |
|
2005 Feb 21-24 |
51 |
45 |
4 |
|
2005 Feb 7-10 |
49 |
48 |
3 |
|
2005 Feb 4-6 |
57 |
40 |
3 |
|
2005 Jan 14-16 |
51 |
46 |
3 |
|
2005 Jan 7-9 |
52 |
44 |
4 |
|
2005 Jan 3-5 |
52 |
44 |
4 |
|
2004 |
|
|
|
|
2004 Dec 17-19 |
49 |
46 |
5 |
|
2004 Dec 5-8 |
53 |
44 |
3 |
|
2004 Nov 19-21 |
55 |
42 |
3 |
|
2004 Nov 7-10 |
53 |
44 |
3 |
|
2004 Oct 29-31 |
48 |
47 |
5 |
|
2004 Oct 22-24 |
51 |
46 |
3 |
|
2004 Oct 14-16 |
51 |
47 |
2 |
|
2004 Oct 11-14 |
48 |
49 |
3 |
|
2004 Oct 9-10 |
47 |
49 |
4 |
|
2004 Oct 1-3 |
50 |
48 |
2 |
|
2004 Sep 24-26 |
54 |
44 |
2 |
|
2004 Sep 13-15 |
52 |
45 |
3 |
|
2004 Sep 3-5 |
52 |
46 |
2 |
|
2004 Aug 23-25 |
49 |
47 |
4 |
|
2004 Aug 9-11 |
51 |
46 |
3 |
|
2004 Jul 30-Aug 1 |
48 |
49 |
3 |
|
2004 Jul 19-21 |
49 |
47 |
4 |
|
2004 Jul 8-11 |
47 |
49 |
4 |
|
2004 Jun 21-23 |
48 |
49 |
3 |
|
2004 Jun 3-6 |
49 |
49 |
2 |
|
2004 May 21-23 |
47 |
49 |
4 |
|
2004 May 7-9 |
46 |
51 |
3 |
|
2004 May 2-4 |
49 |
48 |
3 |
|
2004 Apr 16-18 |
52 |
45 |
3 |
|
2004 Apr 5-8 |
52 |
45 |
3 |
|
2004 Mar 26-28 |
53 |
44 |
3 |
|
2004 Mar 8-11 |
50 |
47 |
3 |
|
2004 Mar 5-7 |
49 |
48 |
3 |
|
2004 Feb 16-17 |
51 |
46 |
3 |
|
2004 Feb 9-12 |
51 |
46 |
3 |
|
2004 Feb 6-8 |
52 |
44 |
4 |
|
2004 Jan 29-Feb 1 |
49 |
48 |
3 |
|
2004 Jan 12-15 |
53 |
44 |
3 |
|
2004 Jan 9-11 |
59 |
38 |
3 |
|
2004 Jan 2-5 |
60 |
35 |
5 |
|
2003 |
|
|
|
|
2003 Dec 15-16 |
63 |
34 |
3 |
|
2003 Dec 11-14 |
56 |
41 |
3 |
|
2003 Dec 5-7 |
55 |
43 |
2 |
|
2003 Nov 14-16 |
50 |
47 |
3 |
|
2003 Nov 10-12 |
51 |
45 |
4 |
|
2003 Nov 3-5 |
54 |
43 |
3 |
|
2003 Oct 24-26 |
53 |
42 |
5 |
|
2003 Oct 10-12 |
56 |
40 |
4 |
|
2003 Oct 6-8 |
55 |
42 |
3 |
|
2003 Sep 19-21 |
50 |
47 |
3 |
|
2003 Sep 8-10 |
52 |
43 |
5 |
|
2003 Aug 25-26 |
59 |
37 |
4 |
|
2003 Aug 4-6 |
60 |
36 |
4 |
|
2003 Jul 25-27 |
58 |
38 |
4 |
|
2003 Jul 18-20 |
59 |
38 |
3 |
|
2003 Jul 7-9 |
62 |
34 |
4 |
|
2003 Jun 27-29 |
61 |
36 |
3 |
|
2003 Jun 12-15 |
63 |
33 |
4 |
|
2003 Jun 9-10 |
62 |
34 |
4 |
|
2003 May 30-Jun 1 |
64 |
32 |
4 |
|
2003 May 19-21 |
66 |
30 |
4 |
|
2003 May 5-7 |
69 |
28 |
3 |
|
2003 Apr 22-23 |
70 |
26 |
4 |
|
2003 Apr 14-16 |
71 |
24 |
5 |
|
2003 Apr 7-9 |
69 |
26 |
5 |
|
2003 Apr 5-6 |
70 |
27 |
3 |
|
2003 Mar 29-30 |
71 |
26 |
3 |
|
2003 Mar 24-25 |
69 |
27 |
4 |
|
2003 Mar 22-23 |
71 |
25 |
4 |
|
2003 Mar 14-15 |
58 |
38 |
4 |
|
2003 Mar 3-5 |
57 |
37 |
6 |
|
2003 Feb 24-26 |
57 |
37 |
6 |
|
2003 Feb 17-19 |
58 |
37 |
5 |
|
2003 Feb 7-9 |
61 |
34 |
5 |
|
2003 Feb 3-6 |
59 |
35 |
6 |
|
2003 Jan 31-Feb 2 |
61 |
35 |
4 |
|
2003 Jan 23-25 |
60 |
36 |
4 |
|
2003 Jan 20-22 |
58 |
36 |
6 |
|
2003 Jan 13-16 |
61 |
34 |
5 |
|
2003 Jan 10-12 |
58 |
37 |
5 |
|
2003 Jan 3-5 |
63 |
32 |
5 |
|
|
|
|
|
|
|
Approve |
Disapprove |
No opinion |
|
2002 |
% |
% |
% |
|
2002 Dec 19-22 |
61 |
32 |
7 |
|
2002 Dec 16-17 |
63 |
33 |
4 |
|
2002 Dec 9-10 |
63 |
32 |
5 |
|
2002 Dec 5-8 |
64 |
29 |
7 |
|
2002 Nov 22-24 |
65 |
28 |
7 |
|
2002 Nov 11-14 |
66 |
26 |
8 |
|
2002 Nov 8-10 |
68 |
27 |
5 |
|
2002 Oct 31-Nov 3 |
63 |
29 |
8 |
|
2002 Oct 21-22 |
67 |
28 |
5 |
|
2002 Oct 14-17 |
62 |
31 |
7 |
|
2002 Oct 3-6 |
67 |
28 |
5 |
|
2002 Sep 23-26 |
68 |
26 |
6 |
|
2002 Sep 20-22 |
66 |
30 |
4 |
|
2002 Sep 13-16 |
70 |
26 |
4 |
|
2002 Sep 5-8 |
66 |
30 |
4 |
|
2002 Sep 2-4 |
66 |
29 |
5 |
|
2002 Aug 19-21 |
65 |
28 |
7 |
|
2002 Aug 5-8 |
68 |
26 |
6 |
|
2002 Jul 29-31 |
71 |
23 |
6 |
|
2002 Jul 26-28 |
69 |
26 |
5 |
|
2002 Jul 22-24 |
69 |
24 |
7 |
|
2002 Jul 9-11 |
73 |
21 |
6 |
|
2002 Jul 5-8 |
76 |
18 |
6 |
|
2002 Jun 28-30 |
76 |
19 |
5 |
|
2002 Jun 21-23 |
73 |
21 |
6 |
|
2002 Jun 17-19 |
74 |
20 |
6 |
|
2002 Jun 7-8 |
74 |
18 |
8 |
|
2002 Jun 3-6 |
70 |
23 |
7 |
|
2002 May 28-29 |
77 |
17 |
6 |
|
2002 May 20-22 |
76 |
17 |
7 |
|
2002 May 6-9 |
76 |
19 |
5 |
|
2002 Apr 29-May 1 |
77 |
20 |
3 |
|
2002 Apr 22-24 |
77 |
17 |
6 |
|
2002 Apr 8-11 |
75 |
20 |
5 |
|
2002 Apr 5-7 |
76 |
19 |
5 |
|
2002 Mar 22-24 |
79 |
17 |
4 |
|
2002 Mar 18-20 |
79 |
16 |
5 |
|
2002 Mar 8-9 |
80 |
14 |
6 |
|
2002 Mar 4-7 |
77 |
18 |
5 |
|
2002 Mar 1-3 |
81 |
14 |
5 |
|
2002 Feb 8-10 |
82 |
14 |
4 |
|
2002 Feb 4-6 |
82 |
14 |
4 |
|
2002 Jan 25-27 |
84 |
13 |
3 |
|
2002 Jan 11-14 |
83 |
13 |
4 |
|
2002 Jan 7-9 |
84 |
12 |
4 |
|
2001 |
|
|
|
|
2001 Dec 14-16 |
86 |
11 |
3 |
|
2001 Dec 6-9 |
86 |
10 |
4 |
|
2001 Nov 26-27 |
87 |
8 |
5 |
|
2001 Nov 8-11 |
87 |
9 |
4 |
|
2001 Nov 2-4 |
87 |
9 |
4 |
|
2001 Oct 19-21 |
88 |
9 |
3 |
|
2001 Oct 11-14 |
89 |
8 |
3 |
|
2001 Oct 5-6 |
87 |
10 |
3 |
|
2001 Sep 21-22 |
90 |
6 |
4 |
|
2001 Sep 14-15 |
86 |
10 |
4 |
|
2001 Sep 7-10 |
51 |
39 |
10 |
|
2001 Aug 24-26 |
55 |
36 |
9 |
|
2001 Aug 16-19 |
57 |
34 |
9 |
|
2001 Aug 10-12 |
57 |
35 |
8 |
|
2001 Aug 3-5 |
55 |
35 |
10 |
|
2001 Jul 19-22 |
56 |
33 |
11 |
|
2001 Jul 10-11 |
57 |
35 |
8 |
|
2001 Jun 28-Jul 1 |
52 |
34 |
14 |
|
2001 Jun 11-17 |
55 |
33 |
12 |
|
2001 Jun 8-10 |
55 |
35 |
10 |
|
2001 May 18-20 |
56 |
36 |
8 |
|
2001 May 10-14 |
56 |
31 |
13 |
|
2001 May 7-9 |
53 |
33 |
14 |
|
2001 Apr 20-22 |
62 |
29 |
9 |
|
2001 Apr 6-8 |
59 |
30 |
11 |
|
2001 Mar 26-28 |
53 |
29 |
18 |
|
2001 Mar 9-11 |
58 |
29 |
13 |
|
2001 Mar 5-7 |
63 |
22 |
15 |
|
2001 Feb 19-21 |
62 |
21 |
17 |
|
2001 Feb 9-11 |
57 |
25 |
18 |
|
2001 Feb 1-4 |
57 |
25 |
18 |
2. Do you approve or disapprove of the way George W. Bush is handling -- [RANDOM ORDER]?
A. The economy
|
|
Approve |
Disapprove |
No opinion |
|
% |
% |
% |
|
|
2005 Feb 25-27 |
48 |
49 |
3 |
|
2005 Feb 7-10 |
45 |
52 |
3 |
|
2005 Feb 4-6 |
50 |
47 |
3 |
|
2005 Jan 7-9 |
50 |
48 |
2 |
|
2004 Nov 7-10 |
47 |
51 |
2 |
|
2004 Oct 14-16 |
46 |
51 |
3 |
|
2004 Sep 24-26 |
49 |
48 |
3 |
|
2004 Aug 9-11 |
46 |
51 |
3 |
|
2004 Jun 21-23 |
47 |
50 |
3 |
|
2004 Jun 3-6 |
41 |
58 |
1 |
|
2004 May 7-9 |
41 |
56 |
3 |
|
2004 May 2-4 |
41 |
56 |
3 |
|
2004 Apr 16-18 |
46 |
52 |
2 |
|
2004 Mar 26-28 |
42 |
55 |
3 |
|
2004 Feb 9-12 |
45 |
52 |
3 |
|
2004 Jan 29-Feb 1 |
43 |
54 |
3 |
|
2004 Jan 2-5 |
54 |
43 |
3 |
|
2003 Dec 5-7 |
48 |
49 |
3 |
|
2003 Nov 3-5 |
47 |
50 |
3 |
|
2003 Oct 6-8 |
42 |
55 |
3 |
|
2003 Sep 8-10 |
45 |
53 |
2 |
|
2003 Aug 25-26 |
45 |
52 |
3 |
|
2003 Jul 25-27 |
46 |
51 |
3 |
|
2003 Jul 18-20 |
45 |
51 |
4 |
|
2003 Jul 7-9 |
48 |
50 |
2 |
|
2003 Jun 12-15 |
48 |
48 |
4 |
|
2003 May 5-7 |
53 |
44 |
3 |
|
2003 Apr 14-16 |
49 |
45 |
6 |
|
2003 Mar 29-30 |
49 |
47 |
4 |
|
2003 Mar 24-25 |
52 |
42 |
6 |
|
2003 Mar 14-15 |
44 |
52 |
4 |
|
2003 Feb 3-6 |
44 |
52 |
4 |
|
2003 Jan 31-Feb 2 |
47 |
48 |
5 |
|
2003 Jan 23-25 |
46 |
49 |
5 |
|
2003 Jan 10-12 |
48 |
47 |
5 |
|
2003 Jan 3-5 |
49 |
47 |
4 |
|
2002 Dec 9-10 |
49 |
47 |
4 |
|
2002 Nov 8-10 |
55 |
39 |
6 |
|
2002 Oct 21-22 |
49 |
44 |
7 |
|
2002 Jul 26-28 |
52 |
43 |
5 |
|
2002 Jul 5-8 |
58 |
36 |
6 |
|
2002 Jun 28-30 |
63 |
33 |
4 |
|
2002 May 20-22 |
61 |
29 |
10 |
|
2002 Apr 5-7 |
60 |
33 |
7 |
|
2002 Mar 22-24 |
65 |
29 |
6 |
|
2002 Mar 1-3 |
64 |
31 |
5 |
|
2002 Feb 4-6 |
66 |
30 |
4 |
|
2002 Jan 25-27 |
64 |
30 |
6 |
|
2001 Nov 2-4 |
71 |
24 |
5 |
|
2001 Oct 5-6 |
72 |
23 |
5 |
|
2001 Jul 10-11 |
54 |
36 |
10 |
|
2001 May 18-20 |
51 |
41 |
8 |
|
2001 Apr 20-22 |
55 |
38 |
7 |
|
2001 Mar 9-11 |
55 |
32 |
13 |
|
2001 Feb 1-4 |
53 |
27 |
20 |
B. Foreign affairs
|
|
Approve |
Disapprove |
No opinion |
|
% |
% |
% |
|
|
2005 Feb 25-27 |
50 |
46 |
4 |
|
2005 Feb 7-10 |
45 |
52 |
3 |
|
2005 Feb 4-6 |
51 |
44 |
5 |
|
2005 Jan 7-9 |
47 |
49 |
4 |
|
2004 Nov 7-10 |
47 |
50 |
3 |
|
2004 Sep 24-26 |
49 |
48 |
3 |
|
2004 Aug 9-11 |
44 |
51 |
5 |
|
2004 Jun 3-6 |
44 |
54 |
2 |
|
2004 May 2-4 |
42 |
53 |
5 |
|
2004 Feb 9-12 |
46 |
52 |
2 |
|
2004 Jan 29-Feb 1 |
46 |
51 |
3 |
|
2004 Jan 2-5 |
58 |
39 |
3 |
|
2003 Dec 5-7 |
53 |
43 |
4 |
|
2003 Nov 3-5 |
46 |
50 |
4 |
|
2003 Oct 6-8 |
49 |
49 |
2 |
|
2003 Sep 8-10 |
52 |
45 |
3 |
|
2003 Aug 25-26 |
55 |
42 |
3 |
|
2003 Jul 25-27 |
54 |
42 |
4 |
|
2003 Jul 18-20 |
54 |
41 |
5 |
|
2003 Jul 7-9 |
55 |
42 |
3 |
|
2003 Jun 12-15 |
58 |
39 |
3 |
|
2003 May 5-7 |
68 |
30 |
2 |
|
2003 Apr 14-16 |
65 |
31 |
4 |
|
2003 Mar 29-30 |
64 |
31 |
5 |
|
2003 Mar 24-25 |
65 |
30 |
5 |
|
2003 Mar 14-15 |
53 |
43 |
4 |
|
2003 Feb 3-6 |
49 |
46 |
5 |
|
2003 Jan 31-Feb 2 |
57 |
39 |
4 |
|
2003 Jan 23-25 |
50 |
45 |
5 |
|
2003 Jan 10-12 |
53 |
42 |
5 |
|
2003 Jan 3-5 |
60 |
35 |
5 |
|
2002 Dec 9-10 |
59 |
35 |
6 |
|
2002 Nov 8-10 |
59 |
36 |
5 |
|
2002 Oct 21-22 |
58 |
35 |
7 |
|
2002 Jul 26-28 |
63 |
30 |
7 |
|
2002 Jul 5-8 |
71 |
25 |
4 |
|
2002 Jun 28-30 |
66 |
27 |
7 |
|
2002 May 20-22 |
70 |
23 |
7 |
|
2002 Apr 5-7 |
70 |
24 |
6 |
|
2002 Mar 22-24 |
71 |
22 |
7 |
|
2002 Mar 1-3 |
78 |
17 |
5 |
|
2002 Feb 4-6 |
79 |
16 |
5 |
|
2002 Jan 25-27 |
83 |
14 |
3 |
|
2001 Oct 5-6 |
81 |
14 |
5 |
|
2001 Jul 10-11 |
54 |
33 |
13 |
|
2001 May 18-20 |
55 |
35 |
10 |
|
2001 Apr 20-22 |
56 |
31 |
13 |
|
2001 Mar 9-11 |
52 |
27 |
21 |
|
2001 Feb 1-4 |
46 |
21 |
33 |
C. The situation in Iraq
|
|
Approve |
Disapprove |
No opinion |
|
% |
% |
% |
|
|
2005 Feb 25-27 |
45 |
53 |
2 |
|
|
|
|
|
|
2005 Feb 4-6 |
50 |
48 |
2 |
|
2005 Jan 7-9 |
42 |
56 |
2 |
|
2004 Nov 7-10 |
47 |
51 |
2 |
|
2004 Oct 14-16 |
46 |
52 |
2 |
|
2004 Sep 24-26 |
48 |
49 |
3 |
|
2004 Aug 9-11 |
45 |
52 |
3 |
|
2004 Jun 21-23 ^ |
42 |
56 |
2 |
|
2004 Jun 3-6 |
41 |
57 |
2 |
|
2004 May 7-9 ^ |
41 |
58 |
1 |
|
2004 May 2-4 |
42 |
55 |
3 |
|
2004 Apr 16-18 |
48 |
49 |
3 |
|
2004 Mar 26-28 |
51 |
47 |
2 |
|
2004 Jan 29-Feb 1 |
46 |
53 |
1 |
|
2004 Jan 2-5 |
61 |
36 |
3 |
|
2003 Dec 5-7 |
50 |
47 |
3 |
|
2003 Nov 3-5 |
45 |
54 |
1 |
|
2003 Oct 6-8 |
47 |
50 |
3 |
|
2003 Sep 8-10 |
51 |
47 |
2 |
|
2003 Aug 25-26 |
57 |
41 |
2 |
|
2003 Jul 25-27 |
60 |
38 |
2 |
|
2003 Jul 18-20 |
57 |
39 |
4 |
|
2003 Jul 7-9 |
58 |
39 |
3 |
|
2003 Jun 12-15 |
63 |
34 |
3 |
|
2003 Apr 14-16 |
76 |
21 |
3 |
|
2003 Mar 29-30 |
71 |
27 |
2 |
|
2003 Mar 24-25 |
71 |
26 |
3 |
|
2003 Mar 14-15 |
56 |
41 |
3 |
|
2003 Jan 31-Feb 2 |
54 |
42 |
4 |
|
2003 Jan 3-5 |
55 |
40 |
5 |
|
2002 Dec 9-10 |
55 |
39 |
6 |
|
2002 Oct 21-22 |
52 |
40 |
8 |
|
|
|
||
|
^ Asked of a half sample |
|||
D. Social Security
|
|
Approve |
Disapprove |
No opinion |
|
% |
% |
% |
|
|
2005 Feb 25-27 |
35 |
56 |
9 |
|
|
|
|
|
|
2005 Feb 4-6 |
43 |
48 |
9 |
|
2005 Jan 7-9 |
41 |
52 |
7 |
|
2002 Mar 22-24 ^ |
47 |
40 |
13 |
|
2001 Jul 10-11 |
49 |
35 |
16 |
|
2001 Mar 9-11 |
49 |
31 |
20 |
|
|
|
|
|
|
^ Asked of a half sample |
|||
E. Terrorism
|
|
Approve |
Disapprove |
No opinion |
|
% |
% |
% |
|
|
2005 Feb 25-27 |
60 |
37 |
3 |
|
|
|
|
|
|
2005 Feb 7-10 |
55 |
42 |
3 |
|
2005 Jan 7-9 |
58 |
39 |
3 |
|
2004 Nov 7-10 |
60 |
37 |
3 |
|
2004 Oct 14-16 |
57 |
41 |
2 |
|
2004 Sep 24-26 |
62 |
36 |
2 |
|
2004 Aug 9-11 |
57 |
40 |
3 |
|
2004 Jun 21-23 ^ |
54 |
44 |
2 |
|
2004 Jun 3-6 |
56 |
43 |
1 |
|
2004 May 7-9 ^ |
54 |
43 |
3 |
|
2004 May 2-4 |
52 |
45 |
3 |
|
2004 Apr 16-18 |
60 |
39 |
1 |
|
2004 Mar 26-28 |
58 |
39 |
3 |
|
2003 Dec 5-7 |
65 |
33 |
2 |
|
2003 Sep 8-10 |
64 |
34 |
2 |
|
2003 Aug 25-26 |
66 |
31 |
3 |
|
2003 Jan 31-Feb 2 |
71 |
26 |
3 |
|
2002 May 20-22 ^ |
83 |
13 |
4 |
|
2002 Apr 5-7 ^ |
83 |
13 |
4 |
|
2002 Mar 20-22 † |
86 |
12 |
2 |
|
2001 Nov 2-4 † |
86 |
12 |
2 |
|
|
|
|
|
|
^ Asked of a half sample |
|||
|
† WORDING: U.S. military action abroad to fight terrorism |
|||
|
‡ Alternate wording asked in Nov 2-4, 2001, and |
|||
Next, turning to the issue of Social Security retirement benefits,
Q.5-6 SPLIT SAMPLED
5. Do you think the federal government should make major changes in the Social Security system to ensure its long-term future -- in the next year or two, within the next 10 years, or do you think major changes are not needed within the next 10 years?
BASED ON 526 NATIONAL ADULTS IN FORM A
|
|
In the next |
Within the |
Changes not |
No |
|
% |
% |
% |
% |
|
|
2005 Feb 25-27 ^ |
38 |
37 |
22 |
3 |
|
|
|
|
|
|
|
2005 Jan 7-9 |
49 |
39 |
9 |
3 |
|
|
|
|
|
|
|
^ Asked of a half sample |
||||
6. Which do you think is riskier for average American workers today -- [ROTATED: investing some of their Social Security taxes in stocks and bonds, (or) relying on the Social Security system to pay them the current level of benefits when they retire]?
BASED ON 482 NATIONAL ADULTS IN FORM B
|
|
Investing in |
Relying on the |
No |
|
|
|
|
|
|
2005 Feb 25-27 |
46% |
50 |
4 |
7. Who do you trust more to deal with the issue of Social Security retirement benefits -- [ROTATED: the Democratic Party (or) the Republican Party]?
|
|
|
BOTH EQUALLY |
|
|
|
|
|
|
|
|
|
|
|
2005 Feb 25-27 |
47% |
37 |
2 |
9 |
5 |
|
(vol.) Volunteered response |
|||||