###Embeddable###
###Embeddable###
###Embeddable###
###Embeddable###
###Embeddable###
###Embeddable###
###Embeddable###
###Embeddable###
###Embeddable###
###Embeddable###
###Embeddable###
###Embeddable###
###Embeddable###
###Embeddable###
###Embeddable###
###Embeddable###
###Embeddable###
###Embeddable###
###Embeddable###
###Embeddable###
###Embeddable###
###Embeddable###
###Embeddable###
###Embeddable###
###Embeddable###
Airlines > Industry Positive Negative Graph % Very/Somewhat positive % Very/Somewhat negative 2025 31 34 2024 37 36 2023 35 38 2022 27 37 2021 33 32 2020 41 26 2019 42 23 2018 43 24 2017 41 35 2016 41 26 2015 35 32 2014 35 29 2013 38 30 2012 31 35 2011 29 39 2010 30 41 2009 32 37 2008 18 52 2007 30 33 2006 33 31 2005 38 27 2004 38 23 2003 37 31 2002 31 30 2001 37 30
Airlines > Industry Positive Negative Table Very positive Somewhat positive Neutral Somewhat negative Very negative No opinion % % % % % % 2025 Aug 1-20 10 21 35 24 10 2 2024 Aug 1-20 8 29 25 26 10 2 2023 Aug 1-23 9 26 27 28 10 * 2022 Aug 1-23 6 21 35 26 11 1 2021 Aug 2-17 8 25 35 23 9 * 2020 Jul 30-Aug 12 10 31 33 18 8 * 2019 Aug 1-14 11 31 32 19 4 2 2018 Aug 1-12 12 31 31 19 5 2 2017 Aug 2-6 9 32 20 24 11 3 2016 Aug 3-7 8 33 30 17 9 2 2015 Aug 5-9 7 28 29 24 8 4 2014 Aug 7-10 7 28 32 21 8 3 2013 Aug 7-11 8 30 29 22 8 4 2012 Aug 9-12 6 25 32 26 9 2 2011 Aug 11-14 5 24 30 26 13 2 2010 Aug 5-8 4 26 25 27 14 4 2009 Aug 6-9 6 26 29 30 7 2 2008 Aug 7-10 3 15 27 29 23 3 2007 Aug 13-16 7 23 33 24 9 4 2006 Aug 7-10 7 26 32 22 9 4 2005 Aug 8-11 6 32 32 21 6 3 2004 Aug 9-11 6 32 33 20 3 6 2003 Aug 4-6 6 31 30 24 7 2 2002 Aug 5-8 7 24 33 24 6 6 2001 Aug 16-19 10 27 29 23 7 4
Airlines > Commercial Air Trips Table None 1 to 2 3 to 4 5 or more No opinion Mean % % % % % 2025 Dec 1-15 56 21 13 11 -- 1.7 2021 Dec 1-16 62 23 7 8 -- 1.4 2015 Dec 2-6 55 25 9 10 * 2.1 2012 Jul 9-12 48 27 13 12 * 2.1 2008 Dec 4-7 56 25 10 8 * 1.7 2007 Dec 6-9 57 23 12 8 -- 1.7 2006 Dec 11-14 52 29 8 11 -- 2.2 2006 Aug 18-20 49 28 15 9 -- 1.9 2005 Dec 5-8 60 25 9 6 -- 1.5 2005 Apr 1-2 49 28 14 9 * 1.9 2004 Dec 5-8 59 23 9 9 -- 1.6 2003 Dec 11-14 60 24 9 7 * 1.5 2002 Sep 2-4 61 24 9 6 -- 1.8 2002 Feb 8-10 48 32 11 9 -- 1.9 2001 Nov 26-27 50 31 10 9 -- 2 2000 Aug 24-27 55 26 10 9 * 1.8 2000 Feb 4-6 55 25 9 11 * 2.1 1999 Nov 18-21 54 26 13 7 * 1.7
Airlines > Satisfaction Aspects Flying Table Satisfied Dissatisfied No opinion % % % The courtesy of the flight attendants 2015 Dec 2-6 94 6 -- 2007 Dec 6-9 92 8 * 2000 Aug 24-27 90 9 1 1999 Aug 3-4 88 11 1 The courtesy of the check-in and gate agents 2015 Dec 2-6 95 4 1 2007 Dec 6-9 88 10 1 2000 Aug 24-27 89 10 1 1999 Aug 3-4 87 13 * The airlines' on-time performance 2015 Dec 2-6 81 18 * 2007 Dec 6-9 69 30 1 2000 Aug 24-27 65 34 1 1999 Aug 3-4 67 33 * The price you pay for tickets 2015 Dec 2-6 51 48 1 2007 Dec 6-9 65 34 2 2000 Aug 24-27 59 39 2 1999 Aug 3-4 45 54 1 Schedules and options for getting where you want to go 2015 Dec 2-6 80 19 * 2007 Dec 6-9 79 20 1 2000 Aug 24-27 79 21 * 1999 Aug 3-4 75 25 0 The speed and reliability of luggage systems 2015 Dec 2-6 78 21 1 2007 Dec 6-9 75 22 3 2000 Aug 24-27 71 26 3 1999 Aug 3-4 67 32 1 The comfort of the seats on the airplanes 2015 Dec 2-6 45 54 * 2007 Dec 6-9 47 53 * The procedures for going through security checkpoints 2015 Dec 2-6 73 27 -- 2007 Dec 6-9 69 31 * Airlines' efforts to deal with flight delays and cancellations 2015 Dec 2-6 62 35 3 2007 Dec 6-9 56 37 7 The process of buying a ticket 2015 Dec 2-6 90 9 1
Airlines > TSA Good Job Table Excellent Good Only fair Poor No opinion % % % % % 2012 Jul 9-12 13 41 30 12 4
Airlines > TSA Effective Terrorism Table Extremely Very Somewhat Not too Not at all No opinion % % % % % % 2012 Jul 9-12 9 32 44 8 5 2
Airlines > Air Trips Typical Year Table Zero One-Two Three-Four Five or more No opinion Mean % % % % % 2008 Apr 18-20 44 35 9 11 * 1.98
Airlines > More Expensive to Fly Table More expensive About the same Less expensive No opinion % % % % 2008 Apr 18-20 71 24 3 2
Airlines > Less Likely Fly Prices Increase Table Less likely to fly Will not affect travel plans No opinion % % % 2008 Apr 18-20 45 54 1
Airlines > Satisfied Job Airlines Doing Table Satisfied Dissatisfied No opinion % % % 2007 Dec 6-9 72 24 3 2000 Aug 24-27 69 29 2 1999 Aug 3-4 65 32 3
Airlines > Feelings About Flying Table Very afraid Somewhat afraid Not very afraid Not afraid at all No opinion % % % % % 2006 Aug 18-20 10 25 24 40 1 2006 Mar 10-12 9 18 18 53 1 2002 Feb 8-10 18 26 17 38 1 2001 Nov 26-27 17 26 18 38 1
Airlines > Terrorism New Airport Security Measures Effective Table Yes, effective No, not effective No opinion % % % 2006 Aug 18-20 77 21 2
Airlines > Sept 11 Permanently Change Rules About Flying Table Permanently changed rules Some rules could be relaxed No opinion % % % 2006 Aug 18-20 71 26 3
Terrorism > Favor Requiring Arabs Intensive Security Checks Table Favor Oppose No opinion % % % 2006 Aug 18-20 ^ 53 45 2 2005 Jul 22-24 ^ 53 46 1 2001 Sep 14-15 58 41 1
Terrorism > Favor Ban Onboard Luggage Table Favor Oppose No opinion % % % 2006 Aug 18-20 ^ 41 57 3 2001 Sep 14-15 51 47 2
Terrorism > Effective Requiring Arabs Intensive Security Checks Table Very effective Somewhat effective Not too effective Not effective at all No opinion % % % % % 2006 Aug 18-20 ^ 37 33 16 11 3
Terrorism > Effective Banning Onboard Luggage Table Very effective Somewhat effective Not too effective Not effective at all No opinion % % % % % 2006 Aug 18-20 ^ 32 35 16 14 2
Terrorism > Effective Running Check Baggage Through Metal Detectors Table Very effective Somewhat effective Not too effective Not effective at all No opinion % % % % % 2006 Aug 18-20 ^ 66 28 5 2 *
Terrorism > Effective Stricter Background Checks Airport Workers Table Very effective Somewhat effective Not too effective Not effective at all No opinion % % % % % 2006 Aug 18-20 ^ 67 25 5 1 1
Terrorism > Ban Liquids Airplanes Appropriate Table Appropriate response Goes too far No opinion % % % 2006 Aug 18-20 70 29 1
Terrorism > Airline Security Measures Annoying Table Yes No No opinion % % % Disposing of any liquids or gels or putting them in checked baggage 2006 Aug 18-20 23 76 * Removing your shoes or belt 2006 Aug 18-20 25 74 1 Having a security agent touch you/your cloting as part of a search 2006 Aug 18-20 36 64 *
Terrorism > Consider Alternative Means to Flying Table Would consider alternative means Would probably fly No opinion % % % 2006 Aug 18-20 46 53 1
Recommended
Americans are less positive toward the grocery and restaurant industries, and more positive toward the sports industry, than they were a year ago.
Americans' opinions of the retail and pharmaceutical industries have suffered the most over the past year, with Democrats increasingly negative about retail and Republicans about the pharmaceutical industry.
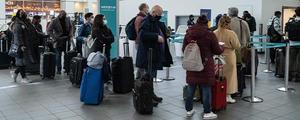
Fewer Americans traveled by air in 2021 than before the pandemic, and those who traveled averaged fewer trips. The decline in air travel since 2015 was only among employed adults; there was no change among nonemployed adults.
Love is essential to Southwest Airlines' historic success. For CEO Gary Kelly, it's the grander purpose that drives great leadership.
Gallup https://news.gallup.com/poll/1579/airlines.aspx Gallup World Headquarters, 901 F Street, Washington, D.C., 20001, U.S.A