Drugs — Recreational and Illegal
###Embeddable###
###Embeddable###
###Embeddable###
###Embeddable###
###Embeddable###
###Embeddable###
###Embeddable###
###Embeddable###
###Embeddable###
###Embeddable###
###Embeddable###
###Embeddable###
###Embeddable###
###Embeddable###
###Embeddable###
###Embeddable###
###Embeddable###
###Embeddable###
###Embeddable###
###Embeddable###
###Embeddable###
###Embeddable###
###Embeddable###
###Embeddable###
###Embeddable###
Drugs > Marijuana Use Legal Graph % Yes, legal 2025 Oct 64 2024 Oct 68 2023 Oct 70 2022 Oct 68 2021 Oct 68 2020 Oct 68 2019 Oct 66 2019 May 64 2018 Oct 66 2017 Oct 64 2016 Oct 60 2015 Oct 58 2014 Oct 51 2013 Oct 58 2012 Nov 48 2011 Oct 50 2010 Oct. 46 2009 Oct 44 2005 Oct 36 2003 Nov 34 2001 Aug 34 2000 Aug 31 1995 Aug 25 1985 May 23 1980 Jun 25 1979 May 25 1977 Apr 28 1973 Jan 16 1972 Mar 15 1969 Oct 12
Drugs > Marijuana Use Legal Table Yes, legal No, not legal No opinion % % % 2025 Oct 1-16 64 33 2 2024 Oct 1-12 68 31 1 2023 Oct 2-23 70 29 1 2022 Oct 3-20 68 31 1 2021 Oct 1-19 68 32 * 2020 Sep 30-Oct 15 68 32 * 2019 Oct 1-13 66 33 1 2019 May 15-30 64 34 2 2018 Oct 1-10 66 32 2 2017 Oct 5-11 64 34 2 2016 Oct 5-9 60 39 1 2015 Oct 7-11 58 40 2 2014 Oct 12-15 51 47 2 2013 Oct 3-6 58 39 3 2012 Nov 26-29 48 50 1 2011 Oct 6-9 50 46 3 2010 Oct 7-10 ^ 46 50 4 2009 Oct 1-4 ^ 44 54 2 2005 Oct 13-16 ^ 36 60 4 2003 Nov 10-12 ^ 34 64 2 2001 Aug 3-5 34 62 4 2000 Aug 29-Sep 5 ^ 31 64 5 1995 Aug 28-30 25 73 2 1985 May 17-20 23 73 4 1980 Jun 27-30 25 70 5 1979 May 18-21 25 70 5 1977 Apr 1-4 28 66 6 1973 Jan 26-29 16 78 6 1972 Mar 3-5 15 81 4 1969 Oct 2-7 12 84 4
Drugs > Worry Drug Use March Table Great deal Fair amount Only a little Not at all No opinion % % % % % 2026 Mar 2-18 37 28 20 14 1 2025 Mar 3-16 39 29 18 14 1 2024 Mar 1-20 45 25 17 12 * 2023 Mar 1-23 46 24 19 10 * 2022 Mar 1-18 38 29 22 11 - 2021 Mar 1-15 39 28 20 12 * 2020 Mar 2-13 42 25 20 12 * 2019 Mar 1-10 47 26 16 11 1 2018 Mar 1-8 45 25 16 13 1 2017 Mar 1-5 44 22 21 13 * 2016 Mar 2-6 44 23 18 15 * 2015 Mar 5-8 38 24 21 17 * 2014 Mar 6-9 ^ 34 29 25 12 * 2013 Mar 7-10 36 24 23 17 * 2012 Mar 8-11 42 24 21 13 * 2011 Mar 3-6 40 24 21 14 1 2010 Mar 4-7 37 27 22 13 1 2008 Mar 6-9 43 24 24 9 * 2007 Mar 11-14 45 26 20 8 * 2006 Mar 13-16 48 25 18 9 * 2005 Mar 7-10 42 23 24 11 * 2004 Mar 8-11 46 19 20 14 1 2003 Mar 24-25 42 26 20 12 * 2002 Mar 4-7 49 22 19 9 1 2001 Mar 5-7 58 22 13 7 *
Drugs > Serious Problem Table Extremely serious Very serious Moderately serious Not too serious Not serious at all No opinion % % % % % % <b>In the United States</b> 2025 36 35 25 3 1 1 2023 45 29 20 3 2 * 2021 33 31 26 7 2 1 2019 37 36 22 4 1 * 2018 37 32 22 5 2 2 2017 33 38 23 4 1 * 2016 32 33 27 6 2 2 2011 n/a n/a n/a n/a n/a n/a 2009 35 33 26 5 1 1 2007 35 38 24 1 1 1 2005 37 33 23 5 1 1 2003 31 40 24 3 1 1 2000 43 40 15 1 1 * <b>In the area where you live</b> 2025 11 18 35 24 10 2 2023 19 16 36 18 10 * 2021 15 16 28 28 13 1 2019 16 17 37 22 8 * 2018 14 17 37 22 10 1 2017 13 16 36 20 12 2 2016 13 19 35 20 11 1 2011 11 18 36 25 10 1 2009 14 16 38 23 8 1 2007 14 15 39 21 10 2 2005 14 19 35 23 8 1 2003 13 17 36 22 11 1 2000 13 21 39 19 6 2
Drugs > Progress Coping Problem Illegal Drugs Table Made much progress Made some progress Stood still Lost some ground Lost much ground No opinion % % % % % % 2025 Oct 1-16 10 35 28 15 8 4 2023 Oct 2-23 2 22 23 23 29 1 2019 Oct 1-13 4 37 27 18 12 2 2018 Oct 1-10 5 33 26 19 14 3 2017 Oct 5-11 2 30 28 23 14 2 2011 Oct 6-9 3 28 31 21 14 3 2009 Oct 1-4 3 30 31 19 13 3 2007 Oct 4-7 3 31 31 19 13 3 2005 Oct 13-16 2 31 30 23 13 1 2003 Oct 6-8 3 35 32 17 11 2 2000 Aug 29-Sep 5 6 41 23 17 12 1 1999 Sep 23-26 4 42 27 14 12 1 1996 Nov 21-24 3 28 22 24 22 1 1995 Sep 14-17 2 36 30 19 11 2 1976 Jun 2 25 29 25 15 4 1974 Apr 4 36 21 19 16 5 1972 May 3 32 20 21 20 5
Drugs > Smoke Marijuana Table Yes, do No, do not No opinion % % % 2025 Jul 7-21 14 86 1 2024 Jul 1-21 ^ 13 87 * 2023 Jul 3-27 ^ 17 83 * 2022 Jul 5-26 ^ 16 84 * 2021 Jul 6-21 ^ 12 87 * 2019 Jul 1-12 ^ 12 88 * 2017 Jul 5-9 ^ 12 88 1 2016 Jul 13-17 ^ 13 87 * 2015 Jul 8-12 ^ 11 88 * 2013 Jul 10-14 ^ 7 93 *
Drugs > Ever Tried Marijuana Table Yes, have tried No, have not No opinion % % % 2024 Jul 1-21 ^ 44 56 * 2023 Jul 3-27 ^ 50 49 * 2022 Jul 5-26 ^ 48 52 - 2021 Jul 6-21 ^ 49 51 * 2019 Jul 1-12 ^ 45 55 1 2017 Jul 5-9 ^ 45 55 * 2016 Jul 13-17 ^ 43 57 1 2015 Jul 8-12 ^ 44 55 1 2013 Jul 10-14 ^ 38 61 1 1999 Sep 23-26 34 66 * 1985 May 17-20 # 33 67 * 1977 Mar 29 # 24 76 1 1973 Mar 23 # 12 88 1 1972 Feb 29 # 11 88 1 1969 Oct 2-7 # 4 88 8
Drugs > Marijuana Edible Use Table Yes, do No, do not No opinion % % % 2024 Jul 1-21 12 88 * 2022 Jul 5-26 14 86 *
Drugs > Marijuana Effects People Society Table Very positive Somewhat positive Somewhat negative Very negative No opinion % % % % % Most users 2024 Jul 1-21 7 36 32 19 6 2022 Jul 5-26 9 44 30 15 2 Society 1 2024 Jul 1-21 6 35 34 20 5 2022 Jul 5-26 12 37 31 19 1
Drugs > How Harmful Products Table Very harmful Somewhat harmful Not too harmful Not at all harmful Depends (vol.) No opinion % % % % % % Cigarettes 2024 Jul 1-21 79 18 1 1 * * 2023 Jul 3-27 76 19 3 1 * * A pipe 2024 Jul 1-21 44 40 7 3 2 5 2023 Jul 3-27 39 42 11 5 1 3 Cigars 2024 Jul 1-21 45 39 9 4 * 2 2023 Jul 3-27 39 41 15 3 * 1 Chewing tobacco 2024 Jul 1-21 61 31 3 2 * 3 2023 Jul 3-27 58 31 7 2 * 1 E-cigarettes, also known as “vaping” 2024 Jul 1-21 57 34 4 1 * 4 2023 Jul 3-27 54 36 8 1 * 2 Marijuana 2024 Jul 1-21 26 40 22 10 * 2 2023 Jul 3-27 23 35 25 15 1 * Alcohol 2024 Jul 1-21 33 53 8 2 2 1 2023 Jul 3-27 30 50 14 2 4 * Nicotine pouches 2024 Jul 1-21 34 38 10 7 * 11
Drugs > Drugs Cause Trouble Family Table Yes No No opinion % % % 2024 Jul 1-21 24 76 * 2023 Jul 3-27 22 78 * 2021 Oct 1-19 32 68 * 2019 Jul 1-12 27 73 * 2018 Jul 1-11 30 70 * 2005 Oct 13-16 22 78 * 2003 Oct 6-8 24 76 * 2000 Aug 29-Sep 5 22 78 * 1999 Sep 23-26 17 83 * 1995 Sep 14-17 19 81 *
Drugs > Concern Effects Marijuana Adults Table Very concerned Somewhat concerned Not too concerned Not at all concerned No opinion % % % % % 2023 Jul 3-27 19 26 23 32 1
Drugs > Concern Effects Marijuana Young Adults Table Very concerned Somewhat concerned Not too concerned Not at all concerned No opinion % % % % % 2023 Jul 3-27 40 35 15 10 *
Drugs > Smoking Marijuana Morally Acceptable Table Morally acceptable Morally wrong Depends (vol.) Not a moral issue (vol.) No opinion % % % % % 2020 May 1-13 ^ 70 28 2 * * 2019 May 1-12 ^ 65 33 1 1 * 2018 May 1-10 ^ 65 31 3 * 2
Drugs > Why Favor Legal Marijuana Table Very important Somewhat important Not important No opinion % % % % Marijuana helps people who use it for medical reasons 86 12 2 * It would free up law enforcement to focus on other types of crime 70 23 7 * It is a matter of freedom and personal choice 60 29 11 * It will provide a good source of tax revenue for state and local governments 56 30 13 * Government regulation of marijuana would make it safer for those who use it 47 36 16 * You do not believe marijuana is harmful to people who use it 35 43 19 3
Drugs > Why Oppose Legal Marijuana Table Very important Somewhat important Not important No opinion % % % % It would increase the number of car accidents involving drivers who use marijuana 79 12 8 * It would lead to more people using stronger and more addictive drugs 69 18 13 * It would encourage more people to use marijuana 62 21 17 * Legalizing marijuana would not benefit society or individuals much 60 21 18 * You believe marijuana is harmful to people who use it 54 22 24 * You believe the use of drugs, including marijuana, is immoral 43 25 31 1
Drugs > Use Marijuana Regularly Occasionally Table Regularly Occasionally Never No opinion % % % % 2018 Jul 1-11 5 8 87 *
Drugs > How Harmful Marijuana Table Very harmful Somewhat harmful Not too harmful Not at all harmful Depends (vol.) No opinion % % % % % % 2018 Jul 1-11 27 29 24 18 1 1
Drugs > Crisis Local Area Drugs Table Crisis Very serious problem Somewhat serious problem Not much of a problem No opinion % % % % % Heroin 17 25 22 29 7 Prescription painkillers 14 30 28 24 5 Cigarettes 10 23 33 33 2 Alcohol 8 24 35 32 1 Cocaine 8 20 29 37 7 Marijuana 6 17 25 50 2
Drugs > Heard Opioid Problem Table A lot Some Only a little Nothing at all No opinion % % % % % 2016 Jun 14-23 46 19 15 18 1
Drugs > Blame for Opioid Problem Table A lot Some Only a little Not at all No opinion % % % % % The pharmaceutical industry encouraging doctors to use opioids 55 22 13 7 4 Doctors overprescribing painkillers to their patients 53 27 14 5 2 Lack of public knowledge about the dangers of opioids 49 28 14 8 1 Patients demanding that they be given a prescription to ease their pain 47 29 16 5 3
Drugs > Federal Government Enforce Anti-Marijuana Laws Table Yes, should No, should not No opinion % % % 2012 Nov 26-29 34 64 1
Drugs > Marijuana Pain Suffering Table Favor Oppose No opinion % % % 2010 Oct 7-10 70 27 3 2005 Oct 13-16 78 22 * 2003 Nov 10-12 75 22 3 1999 Mar 19-21 ^ 73 25 2
Drugs > Marijuana Tax State Revenue Table Favor Oppose No opinion % % % 2009 Oct 1-4 ^ 42 56 2
Drugs > Marijuana Possession Small Amounts Criminal Table Yes, should be No, should not be No opinion % % % 2005 Oct 13-16 ^ 43 55 2 2003 Nov 10-12 ^ 52 46 1 2000 Aug 29-Sep 5 ^ 51 47 2 1985 May 17-20 50 46 4 1980 Jun 27-30 43 52 5 1977 Apr 1-4 41 53 6
Recommended
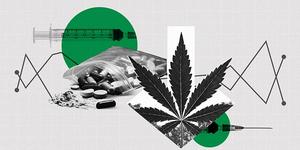
Two years after expressing record pessimism about the U.S. illegal drug problem, Americans are the most optimistic they have been in a quarter century.
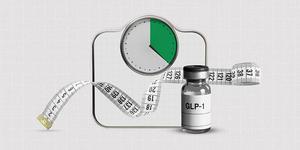
The U.S. obesity rate is showing signs of abating from its 2022 high. GLP-1 antidiabetic injectables used for weight loss may be playing a role.
A record-low 54% of Americans say they drink alcohol, as a majority now believe moderate drinking is unhealthy.
Fifteen percent of Americans say they smoke marijuana, according to combined 2023 and 2024 data.
Gallup https://news.gallup.com/poll/1657/illegal-drugs.aspx Gallup World Headquarters, 901 F Street, Washington, D.C., 20001, U.S.A