GALLUP NEWS SERVICE
PRINCETON, NJ -- Whites and blacks have sharply differing reactions to the federal government's response to Hurricane Katrina, with blacks more likely than whites to believe that racial bias was a factor in slowing the government's response, and blacks especially critical of President Bush's performance.
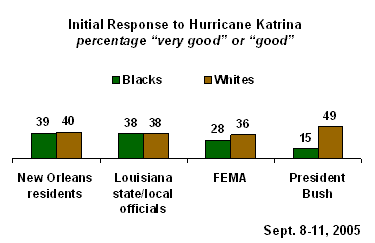
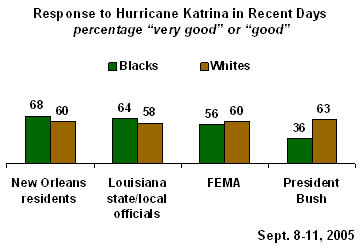
Aside from Bush, whites and blacks have similar perspectives on how various entities handled themselves in the Hurricane Katrina disaster. Most whites and blacks agree that FEMA, state and local Louisiana authorities, and New Orleans residents did a poor job initially, but that in recent days each has been doing a good job.
There is much more of a racial divide in assessments of Bush. Only 15% of blacks versus 49% of whites say Bush did a good job initially. Only 36% of blacks versus 63% of whites say Bush has been doing a good job in recent days.
Blacks See Racial Bias at Work
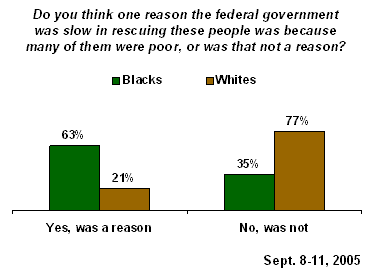
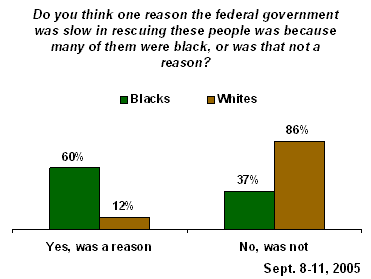
There is a wide racial gap in perceptions of the role that the hurricane victims' socioeconomic status played in the federal government's willingness to get involved. The vast majority of blacks believe the government was slow in rescuing people specifically because the people affected are primarily black, and also because they are poor. Whites overwhelmingly reject these explanations.
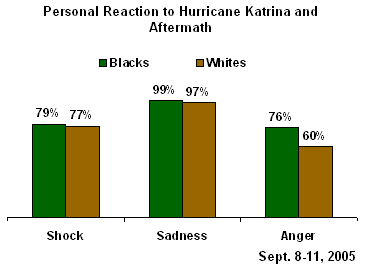
These perceptions likely explain why blacks tend to be more likely than whites to report feeling anger in response to Hurricane Katrina and its aftermath (76% of blacks vs. 60% of whites).
At the same time, nearly all whites and blacks say they have felt sadness, and close to 8 in 10 have felt shock.
Blacks' Basic Ratings of Bush Haven't Changed
Whether the New Orleans crisis has harmed Bush's reputation in the black community or merely reinforced pre-existing criticism of him is not entirely clear. On the surface, it appears as if the federal response to Hurricane Katrina has not changed blacks' fundamental perceptions of Bush or the Republican Party -- perceptions that were already quite negative.
The percentage of blacks approving of the job Bush is doing as president is 14% today, little different from the 15% recorded in August. Similarly, the percentage of blacks holding a favorable view of the Republican Party is now 16%, versus 18% earlier this year.
Finding Fault
While Bush appears to be the focal point for blacks' anger about the less-than-optimal government response to Hurricane Katrina, blacks as well as whites find plenty of blame to go around.
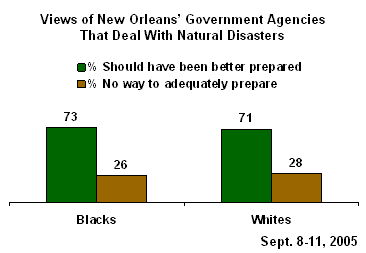
About 7 in 10 whites, and a similar proportion of blacks, believe that the government agencies in New Orleans responsible for dealing with natural disasters could have been better prepared to respond to Hurricane Katrina.
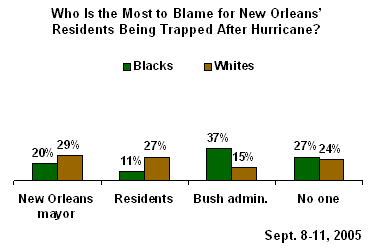
When asked whether the mayor of New Orleans, the residents of New Orleans, Bush, or no one is most to blame for the fact that so many residents were trapped in New Orleans after the hurricane, the plurality of blacks (37%) cite President Bush. However, the combined percentage who blame either the mayor of New Orleans (20%) or the residents themselves (11%) is nearly as large.
Whites spread out their blame more evenly. About one-quarter each blame the mayor, the residents, and no one, while the fewest number of whites (15%) blame Bush.
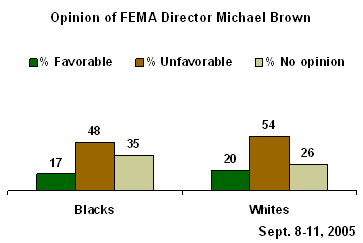
Whites and blacks are in much closer agreement in their evaluations of FEMA Director Michael Brown (who has subsequently resigned his position). Only about one in five whites and blacks view Brown favorably, while about half view him unfavorably.
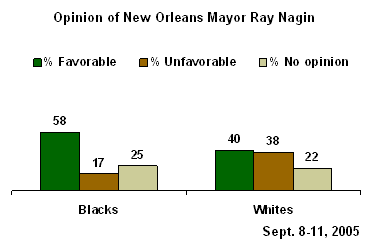
Much greater disparity is seen in blacks' and whites' reactions to New Orleans Mayor Ray Nagin. Most blacks have favorable impressions of Nagin, who is black, while whites are about evenly divided in their assessments of him.
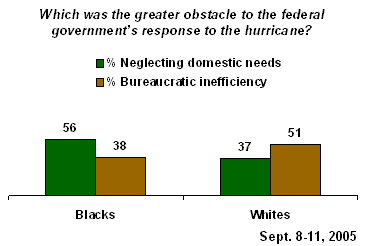
Not only do blacks perceive racial bias in the federal government's handling of the post-Katrina situation, but when asked to choose between two explanations for why the government had difficulty responding, most blacks opt for the more critical reason. Fifty-six percent of blacks say it was due to "neglecting domestic needs like emergency preparedness and infrastructure." The slim majority of whites, 51%, choose the more benign explanation of "bureaucratic inefficiency."
Highlighting the degree to which politics play a role in perceptions of blame, blacks tend to say that the Republicans in Congress are spending too little time in figuring out who is to blame for the problems in the areas affected by Katrina (60% of blacks say this), while whites tend to say Democrats are spending too much time on this (49%). The majority of whites think the media are also spending too much time (51%), while most blacks (58%) think the media are spending the right amount of time on this issue.
Additional Findings
Three-quarters of blacks (77%), compared with only 44% of whites, consider the post-hurricane looters in New Orleans to have been mostly desperate people trying to keep themselves alive. Half of whites and only 16% of blacks view them as mostly criminals taking advantage of the situation.
Blacks are bothered, while whites are not, by the use of the term "refugees" to describe the residents of areas hit by Hurricane Katrina who have had to evacuate. The Rev. Jesse Jackson, among other civil rights figures, has stated that the use of the term is racist in this context, saying U.S. citizens should never be called "refugees."
A majority of whites (67%) and an especially large percentage of blacks (88%) would like to see an independent investigation conducted to review the problems with the government's response to the hurricane.
Blacks are a bit more optimistic than whites that when New Orleans is rebuilt, government planners will succeed in making the city less segregated than it was before the hurricane. Close to half of blacks (46%), but only 32% of whites, think planners will be at least somewhat successful at achieving this goal.
Whites and blacks have slightly different responses to how they would react if they were confronted with a New Orleans-like situation. Most whites (67%) say that if their homes and communities were destroyed in a natural disaster, they would want to go back and rebuild their lives there; only 29% would move to another community. Blacks are more evenly divided, as only 54% say they would go back and rebuild while 41% say they would relocate.
Survey Methods
These results are based on telephone interviews with 262 blacks, aged 18 and older, conducted Sept. 8-11, 2005, some of which were drawn from Gallup's Sept. 8-11 national sample and some of which were drawn from a special black oversample. The combined sample of blacks is weighted to be representative of U.S. blacks. For results based on the total sample, one can say with 95% confidence that the maximum margin of sampling error is ±7 percentage points.
Results for the sample of 848 whites, aged 18 and older, are based on telephone interviews with non-Hispanic whites conducted Sept. 8-11, 2005, and drawn from the national sample poll. For results based on the total sample, one can say with 95% confidence that the maximum margin of sampling error is ±4 percentage points.
For results based on the samples of 223 and 230 blacks, the maximum margin of sampling error is ±7 percentage points.
For results based on the samples of 388 and 460 whites, the maximum margin of sampling error is ±5 percentage points.
In addition to sampling error, question wording and practical difficulties in conducting surveys can introduce error or bias into the findings of public opinion polls.
The sample for this survey did not include the areas of Louisiana and Mississippi that were declared federal disaster areas following Hurricane Katrina. This accounts for about 0.75% of the U.S. population.
1. Do you approve or disapprove of the way George W. Bush is handling his job as president?
|
|
Approve |
Disapprove |
No |
|
Blacks |
% |
% |
% |
|
2005 Sep 8-11 |
14 |
81 |
5 |
|
|
|
|
|
|
2005 Aug ^ |
15 |
82 |
3 |
|
2005 Jun 6-25 |
16 |
77 |
7 |
|
2004 Jun 9-30 |
16 |
79 |
5 |
|
2003 Jun 12-18 |
32 |
57 |
11 |
|
2002 Jun 3-9 |
41 |
48 |
11 |
|
2001 Jun 11-17 |
37 |
50 |
13 |
|
|
|
|
|
|
Non-Hispanic Whites |
|
|
|
|
2005 Sep 8-11 |
51 |
46 |
3 |
|
|
|
|
|
|
2005 Aug ^ |
49 |
47 |
4 |
|
2005 Jun 6-25 |
47 |
48 |
5 |
|
2004 Jun 9-30 |
61 |
38 |
1 |
|
2003 Jun 12-15 |
69 |
28 |
3 |
|
2002 Jun 3-6 |
74 |
20 |
6 |
|
2001 Jun 11-17 |
58 |
31 |
11 |
|
|
|
|
|
|
^ An average of all Gallup and CNN/USA Today/Gallup polls conducted in August. |
|||
4. Next, we'd like to get your overall opinion of some people in the news. As I read each name, please say if you have a favorable or unfavorable opinion of these people -- or if you have never heard of them. How about -- How about -- [ITEMS A-H ROTATED, THEN ITEMS I-J ROTATED]?
D. FEMA Director, Michael Brown
|
|
Favorable |
Unfavorable |
Never |
No |
|
Blacks |
% |
% |
% |
% |
|
2005 Sep 8-11 |
17 |
48 |
23 |
12 |
|
|
|
|
|
|
|
Non-Hispanic Whites |
|
|
|
|
|
2005 Sep 8-11 |
20 |
54 |
15 |
11 |
E. Secretary of Homeland Security, Michael Chertoff
|
|
Favorable |
Unfavorable |
Never |
No |
|
Blacks |
% |
% |
% |
% |
|
2005 Sep 8-11 |
22 |
31 |
31 |
16 |
|
|
|
|
|
|
|
Non-Hispanic Whites |
|
|
|
|
|
2005 Sep 8-11 |
36 |
32 |
15 |
17 |
F. New Orleans Mayor Ray Nagin
|
|
Favorable |
Unfavorable |
Never |
No |
|
Blacks |
% |
% |
% |
% |
|
2005 Sep 8-11 |
58 |
17 |
15 |
10 |
|
|
|
|
|
|
|
Non-Hispanic Whites |
|
|
|
|
|
2005 Sep 8-11 |
40 |
38 |
11 |
11 |
G. Louisiana Governor, Kathleen Blanco
|
|
Favorable |
Unfavorable |
Never |
No |
|
Blacks |
% |
% |
% |
% |
|
2005 Sep 8-11 |
35 |
24 |
29 |
12 |
|
|
|
|
|
|
|
Non-Hispanic Whites |
|
|
|
|
|
2005 Sep 8-11 |
30 |
37 |
18 |
15 |
H. Mississippi Governor, Haley Barbour
|
|
Favorable |
Unfavorable |
Never |
No |
|
Blacks |
% |
% |
% |
% |
|
2005 Sep 8-11 |
28 |
16 |
37 |
19 |
|
|
|
|
|
|
|
Non-Hispanic Whites |
|
|
|
|
|
2005 Sep 8-11 |
41 |
16 |
24 |
19 |
I. The Republican Party
|
|
Favorable |
Unfavorable |
Never |
No |
|
Blacks |
% |
% |
% |
% |
|
2005 Sep 8-11 |
16 |
74 |
2 |
8 |
|
2005 Apr/Jul ^ |
18 |
76 |
2 |
4 |
|
2000 Aug 4-6 † |
22 |
65 |
2 |
11 |
|
|
|
|
|
|
|
Non-Hispanic Whites |
|
|
|
|
|
2005 Sep 8-11 |
50 |
40 |
1 |
9 |
|
2005 Apr/Jul ^ |
53 |
41 |
1 |
5 |
|
2000 Aug 4-5 † |
59 |
33 |
* |
8 |
|
* Less than 0.5% |
||||
|
^ An average of April 1-2 and July 22-24 polls. |
||||
|
† Based on registered voters. |
||||
J. The Democratic Party
|
|
Favorable |
Unfavorable |
Never |
No |
|
Blacks |
% |
% |
% |
% |
|
2005 Sep 8-11 |
72 |
18 |
2 |
8 |
|
2005 Apr/Jul ^ |
73 |
19 |
3 |
5 |
|
2000 Aug 4-6 † |
84 |
11 |
2 |
3 |
|
|
|
|
|
|
|
Non-Hispanic Whites |
|
|
|
|
|
2005 Sep 8-11 |
44 |
43 |
1 |
12 |
|
2005 Apr/Jul ^ |
47 |
43 |
1 |
9 |
|
2000 Aug 4-5 † |
51 |
41 |
* |
8 |
|
* Less than 0.5% |
||||
|
^ An average of April 1-2 and July 22-24 polls. |
||||
|
† Based on registered voters. |
||||
12. Now thinking about what happened immediately after Hurricane Katrina hit and NOT what has happened in the past few days, how would you rate the way -- [RANDOM ORDER] -- initially responded to the hurricane -- as very good, good, poor, or very poor?
BASED ON 223 BLACKS
BASED ON 460 NON-HISPANIC WHITES
A. George W. Bush
|
|
Very |
Good |
Poor |
Very |
No |
|
Blacks |
% |
% |
% |
% |
% |
|
2005 Sep 8-11 |
5 |
10 |
30 |
54 |
1 |
|
|
|
|
|
|
|
|
Non-Hispanic Whites |
|
|
|
|
|
|
2005 Sep 8-11 |
12 |
37 |
22 |
27 |
2 |
B. FEMA and other federal government agencies responsible for handling emergencies
|
|
Very |
Good |
Poor |
Very |
No |
|
Blacks |
% |
% |
% |
% |
% |
|
2005 Sep 8-11 |
7 |
21 |
29 |
41 |
2 |
|
|
|
|
|
|
|
|
Non-Hispanic Whites |
|
|
|
|
|
|
2005 Sep 8-11 |
8 |
28 |
32 |
30 |
2 |
C. State and local officials in Louisiana
|
|
Very |
Good |
Poor |
Very |
No |
|
Blacks |
% |
% |
% |
% |
% |
|
2005 Sep 8-11 |
9 |
29 |
35 |
23 |
4 |
|
|
|
|
|
|
|
|
Non-Hispanic Whites |
|
|
|
|
|
|
2005 Sep 8-11 |
7 |
31 |
32 |
27 |
3 |
D. The residents of New Orleans
|
|
Very |
Good |
Poor |
Very |
No |
|
Blacks |
% |
% |
% |
% |
% |
|
2005 Sep 8-11 |
11 |
28 |
34 |
18 |
9 |
|
|
|
|
|
|
|
|
Non-Hispanic Whites |
|
|
|
|
|
|
2005 Sep 8-11 |
9 |
31 |
37 |
19 |
4 |
13. Now thinking about what has happened in the past few days in the areas affected by Hurricane Katrina and NOT what happened immediately after it hit, how would you rate the way -- [RANDOM ORDER] -- has responded to the hurricane in the past few days -- as very good, good, poor, or very poor?
BASED ON 230 BLACKS
BASED ON 388 NON-HISPANIC WHITES
A. George W. Bush
|
|
Very |
Good |
Poor |
Very |
No |
|
Blacks |
% |
% |
% |
% |
% |
|
2005 Sep 8-11 |
7 |
29 |
35 |
28 |
1 |
|
|
|
|
|
|
|
|
Non-Hispanic Whites |
|
|
|
|
|
|
2005 Sep 8-11 |
18 |
45 |
23 |
12 |
2 |
B. FEMA and other federal government agencies responsible for handling emergencies
|
|
Very |
Good |
Poor |
Very |
No |
|
Blacks |
% |
% |
% |
% |
% |
|
2005 Sep 8-11 |
15 |
41 |
24 |
19 |
1 |
|
|
|
|
|
|
|
|
Non-Hispanic Whites |
|
|
|
|
|
|
2005 Sep 8-11 |
13 |
47 |
23 |
15 |
2 |
C. State and local officials in Louisiana
|
|
Very |
Good |
Poor |
Very |
No |
|
Blacks |
% |
% |
% |
% |
% |
|
2005 Sep 8-11 |
19 |
45 |
20 |
12 |
4 |
|
|
|
|
|
|
|
|
Non-Hispanic Whites |
|
|
|
|
|
|
2005 Sep 8-11 |
13 |
45 |
27 |
11 |
4 |
D. The residents of New Orleans
|
|
Very |
Good |
Poor |
Very |
No |
|
Blacks |
% |
% |
% |
% |
% |
|
2005 Sep 8-11 |
19 |
49 |
19 |
8 |
5 |
|
|
|
|
|
|
|
|
Non-Hispanic Whites |
|
|
|
|
|
|
2005 Sep 8-11 |
13 |
47 |
25 |
11 |
4 |
19. Do you think -- [ITEMS A-B ROTATED, ITEM C READ LAST] -- are currently spending -- [ROTATED: too much time, the right amount of time, or too little time] -- trying to figure out who is responsible for the problems in the areas affected by the hurricane?
A. The Republican leaders in Congress
|
|
Too much |
Right |
Too little |
No |
|
Blacks |
28% |
9 |
60 |
3 |
|
Whites |
39% |
27 |
28 |
6 |
B. The Democratic leaders in Congress
|
|
Too much |
Right |
Too little |
No |
|
Blacks |
29% |
27 |
39 |
5 |
|
Whites |
49% |
23 |
21 |
7 |
C. The news media
|
|
Too much |
Right |
Too little |
No |
|
Blacks |
29% |
58 |
10 |
3 |
|
Whites |
51% |
42 |
5 |
2 |
