Shortly after Hurricane Katrina hit New Orleans and the surrounding areas, critics charged that a lack of concern for poor and black people who lived in the devastated areas was behind the slow response to the disaster, the assumption being that low-income people and black people were disproportionately likely to be victims. Even among victims, blacks and poor people were seen as more likely to suffer hardships than whites and high-income people.
Results from a CNN/USA Today/Gallup survey* allow a comparison of racial and income effects among actual hurricane victims. The poll was conducted six weeks after the storm hit the Gulf Coast. Interviews were conducted Sept. 30-Oct. 9 among people who had applied for Red Cross assistance because of damage they had suffered from Katrina. The Red Cross database included more than 463,000 names, and the poll interviewed a random sample of 1,510 by telephone, some by landline and others by cell phone.
A comparison of the experiences reported by these people shows that blacks and poor people were indeed more likely than whites and high-income people, respectively, to suffer from the hurricane. It also shows that there were larger racial differences than income differences.
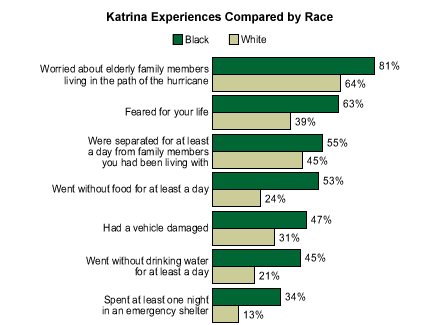
On 7 of the 10 hurricane-related hardships asked about in the poll, black victims were significantly more likely than white victims to say they experienced them. Blacks were significantly more likely than whites to have:
- worried about elderly family members living in the path of the hurricane (81% of blacks vs. 64% of whites)
- feared for their lives (63% vs. 39%)
- been separated from family members for at least a day (55% vs. 45%)
- gone without food for at least a day (53% vs. 24%)
- had a vehicle damaged (47% vs. 31%)
- gone without drinking water for at least a day (45% vs. 21%)
- spent at least one night in an emergency shelter (34% vs. 13%)

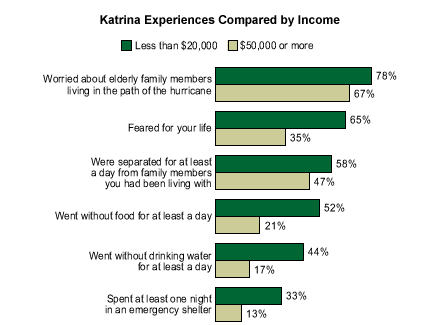
Similarly, low-income victims were more likely to suffer hardships than high-income victims. Compared with people earning more than $50,000 a year, the lowest income group of people (those earning less than $20,000 a year) were much more likely to have:
- worried about elderly family members living in the path of a hurricane (79% of low-income victims vs. 67% of high-income victims)
- feared for their lives (65% vs. 35%)
- been separated at least a day from their families (58% vs. 47%)
- gone without food for at least a day (52% vs. 21%)
- gone without drinking water for at least a day (44% vs. 17%)
- spent at least one night in an emergency shelter (33% vs. 13%)

Because there is a high correlation between income and race, the differences between blacks and whites could be attributable to the different income levels of each group. But, taking the race of those in each income group into account, the data suggest that the differences between racial groups were, on average, much larger than the differences between high- and low-income groups.
These findings are illustrated by a comparison of high- and low-income blacks, with high- and low-income whites, on the question of whether they went without food for at least a day.
Went Without Food for at Least a Day,
Compared by Race and Income
|
High-income |
High-income |
Low-income |
Low-income |
|
|
% who went without food for at least a day |
21 |
40 |
29 |
57 |
Among high-income victims (people with at least $30,000 in annual household income), there is a 19-point difference between the percentage of blacks who went without food (40%) and the percentage of whites (21%). Among low-income victims, the race gap is 28 points (57% of blacks vs. 29% of whites). The weighted average** of the two race differences (19 points and 28 points) is 24.2.
By contrast, the differences between income groups are not as large. Among whites, there is only an eight-point difference between low-income victims who went without food (29%) and high-income victims (21%). Among blacks, the income difference is larger -- 17 points (57% of high-income blacks vs. 40% of low-income blacks). But this income difference is still smaller than the two race differences noted earlier. The weighted average of the two income differences (8 points and 17 points) is 13.1.
The poll shows that both income and race played a significant role in the likelihood that hurricane victims suffered hardships. Separately, among whites and blacks, low-income victims suffered more hardship than high-income victims. Similarly, among low-income victims and high-income victims, blacks suffered more than whites. This analysis also suggests that race was a bigger factor in explaining hardship than income.
*This poll was conducted in cooperation with the American Red Cross.
Results are based on telephone interviews with a sample of 1,510 adults, aged 18 and older, drawn randomly from the American Red Cross database of applicants seeking assistance due to the effects of Hurricane Katrina. Interviews were conducted Sept. 30-Oct. 9, 2005.
The vast majority of applicants provided a working contact telephone number to the Red Cross. Gallup did reverse phone lookups to obtain telephone numbers for the portion of the selected sample that did not provide a contact number. Where necessary, Gallup interviewers tracked down updated telephone numbers when respondents had moved from their previous location. Interviews were conducted on both landline and cellular telephones. Full details on the poll methodology can be found at https://www.galluppoll.com/.
In addition to sampling error, question wording and practical difficulties in conducting surveys can introduce error or bias into the findings of public opinion polls.
**A simple average would just add the two differences and divide by two. In this case, the average was adjusted to take into account the number of cases for which each difference was calculated.
