GALLUP NEWS SERVICE
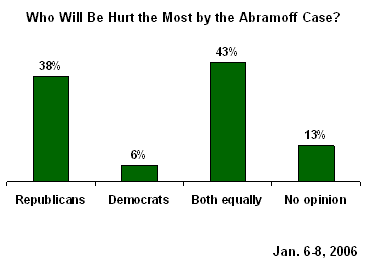
PRINCETON, NJ -- The evidence from the latest CNN/USA Today/Gallup poll suggests that public reaction to the scandal swirling around former lobbyist Jack Abramoff continues to be muted. A majority of Americans call the case "a major scandal," but thus far they report only moderate attention to news about it. Despite reports of strong links between Abramoff -- who pled guilty last week to charges that include bribing public officials -- and some in the Republican Party, the American public tends to think the scandal will hurt the two parties equally (43% say this). However, among those who do perceive a difference in the potential impact of the scandal, the Republicans are far more likely to be seen as vulnerable: while 38% say the Republicans will suffer the most, only 6% say this about the Democrats.
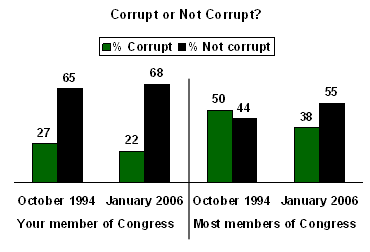
According to the same poll, conducted Jan. 6-8, Americans do not throw the "corruption" charge around easily. Only 22% believe their own member of Congress is corrupt, and just 38% think most members of Congress are corrupt. At the same time, a far greater proportion of Americans believe that special interest groups wield considerable power.
When asked whether their own member of Congress is focused more on the needs of special interests or on the needs of the people of the district, not quite half (49%) credit their member with giving priority to constituents, but 40% say their member caters more to special interests. As for Congress as a whole, a majority of Americans believe that most members of Congress focus more on special interests than on their constituents (54% vs. 40%).
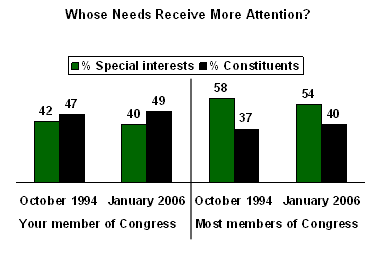
Image of Congress Appears Unshaken
There is no evidence the Abramoff case has sparked newfound alarm about the extent of corruption in Congress. In fact, the percentages today calling their own member and most members of Congress "corrupt" are lower than what was found more than a decade ago. At that time, in October 1994, 27% identified their own member as corrupt and 50% believed the label applied to most members of Congress.
(A similar question asked in December 2005 showed a much higher percentage -- 49% -- saying most members of Congress are corrupt; that result is not comparable to the current result or the 1994 trend due to technical differences in the construction of the questionnaire.)
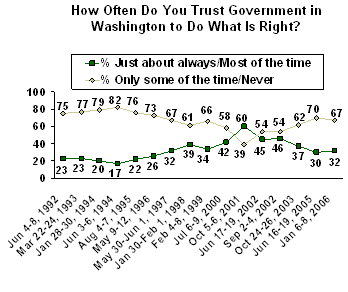
Also, basic public trust in the federal government appears to be similar to where it stood last June. In answer to the question, "How much of the time do you think you can trust the government in Washington to do what is right?" only a third of Americans today (32%) say they can trust the government in Washington all or most of the time. Nearly two-thirds (64%) say they can trust it only some of the time, and 3% volunteer that they can never trust it.
Gallup recorded a high degree of public skepticism about government through most of the 1990s, with the percentage saying that they could trust government all or most of the time dropping to as low as 17% in June 1994. With the exception of a burst of support for government immediately following 9/11, majority distrust of government has continued through today.
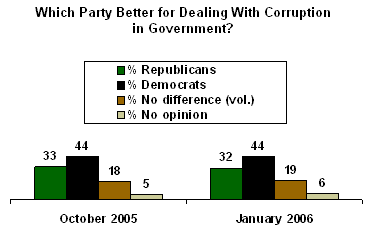
Americans tend to trust the Democrats in Congress more than the Republicans to handle the issue of government corruption. However -- bolstering the thesis that the Abramoff case has not caused further harm to the Republicans' image -- the 44% vs. 32% division on this question is nearly identical to what Gallup found in October.
Only Half of Americans Following the Story Closely
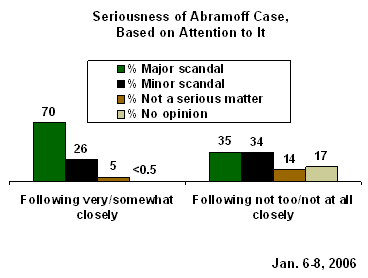
Part of the reason there has not been a public opinion backlash (so far) stemming from reports that Abramoff bribed U.S. senators and representatives could be that Americans are still not paying close attention to the story. Nearly half (49%) admit they are not following news of the case closely. Only 17% are following it "very closely," while another 34% are following it "somewhat closely."
Those following the case closely are much more likely than those not following it closely to believe the case represents a major scandal.
Those following the case closely are also more likely to predict the Republican Party will suffer the most damage from the revelations.
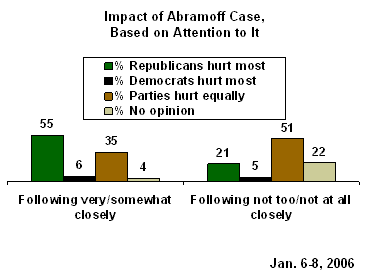
This finding -- that those most familiar with the Abramoff scandal tend to believe the Republicans are the most vulnerable to negative consequences stemming from it -- is not due to Democrats following the case more closely than Republicans. In fact, attention to the story is fairly similar among members of the two parties: 45% of Republicans vs. 56% of Democrats say they are following it closely.
Attention to Abramoff Case Slightly Lower Than Average
The combined 51% of Americans who are following the case very or somewhat closely is slightly below the average level of attention (60% very/somewhat closely) paid to more than 150 news stories Gallup has tested in the last 15 years. By contrast, events such as the 9/11 terrorist attacks, Hurricane Katrina, and the launching of the 2003 Iraq war attracted nearly universal attention from Americans, as more than 9 in 10 followed these stories closely. But even more routine political news, such as the 1993 debate over NAFTA, the issue of school vouchers in 2000, and recent news about war protester Cindy Sheehan have attracted significantly more public attention than the Abramoff story. Attention to the Abramoff story is similar to last year's news of White House adviser Karl Rove's possible role in a CIA-media leak and news in 1997 about alleged Democratic Party fundraising irregularities.
Survey Methods
These results are based on telephone interviews with a randomly selected national sample of 1,003 adults, aged 18 and older, conducted Jan. 6-8, 2006. For results based on this sample, one can say with 95% confidence that the maximum error attributable to sampling and other random effects is ±3 percentage points. In addition to sampling error, question wording and practical difficulties in conducting surveys can introduce error or bias into the findings of public opinion polls.
5. How much of the time do you think you can trust the government in Washington to do what is right -- just about always, most of the time, or only some of the time?
|
|
Just |
Most |
Only |
NEVER |
No |
|
% |
% |
% |
% |
% |
|
|
2006 Jan 6-8 |
4 |
28 |
64 |
3 |
1 |
|
|
|
|
|
|
|
|
2005 Jun 16-19 |
4 |
26 |
65 |
5 |
* |
|
2003 Oct 24-26 |
4 |
33 |
58 |
4 |
1 |
|
2002 Sep 2-4 |
8 |
38 |
52 |
2 |
* |
|
2002 Jun 17-19 |
6 |
39 |
51 |
3 |
1 |
|
2001 Oct 5-6 |
13 |
47 |
38 |
1 |
1 |
|
2000 Jul 6-9 |
4 |
38 |
56 |
2 |
* |
|
1999 Feb 4-8 |
5 |
29 |
64 |
2 |
* |
|
1998 Jan 30-Feb 1 |
6 |
33 |
59 |
2 |
* |
|
1997 May 30-Jun 1 |
3 |
29 |
65 |
2 |
1 |
|
1996 May 9-12 |
2 |
24 |
69 |
4 |
1 |
|
1995 Aug 4-7 |
2 |
20 |
71 |
5 |
2 |
|
1994 Jun 3-6 |
3 |
14 |
73 |
9 |
1 |
|
1994 Jan 28-30 |
1 |
19 |
74 |
5 |
1 |
|
1993 Mar 22-24 |
3 |
20 |
75 |
2 |
* |
|
1992 Jun 4-8 |
2 |
21 |
71 |
4 |
2 |
|
(vol.) = Volunteered response |
|||||
|
* Less than 0.5% |
|||||
Trends for Comparison: University of Michigan National Election Study
|
|
Just |
Most |
Only |
NEVER |
No |
|
% |
% |
% |
% |
% |
|
|
2004 |
4 |
42 |
53 |
1 |
* |
|
2002 |
5 |
50 |
45 |
* |
* |
|
2000 |
4 |
40 |
55 |
1 |
1 |
|
1998 |
4 |
36 |
58 |
1 |
1 |
|
1996 |
3 |
30 |
66 |
1 |
0 |
|
1994 |
2 |
19 |
74 |
3 |
0 |
|
1992 |
3 |
26 |
68 |
2 |
1 |
|
1990 |
3 |
25 |
68 |
2 |
2 |
|
1988 |
4 |
37 |
56 |
2 |
1 |
|
1986 |
3 |
35 |
58 |
2 |
2 |
|
1984 |
4 |
40 |
53 |
1 |
2 |
|
1982 |
2 |
31 |
62 |
2 |
3 |
|
1980 |
2 |
23 |
69 |
4 |
2 |
|
1978 |
2 |
27 |
64 |
4 |
3 |
|
1976 |
3 |
30 |
62 |
1 |
4 |
|
1974 |
2 |
34 |
61 |
1 |
2 |
|
1972 |
5 |
48 |
44 |
1 |
2 |
|
1970 |
7 |
47 |
44 |
* |
2 |
|
1968 |
7 |
54 |
37 |
* |
2 |
|
1966 |
17 |
48 |
28 |
3 |
4 |
|
1964 |
14 |
62 |
22 |
* |
2 |
|
1958 |
16 |
57 |
23 |
0 |
4 |
|
(vol.) = Volunteered response |
|||||
|
* Less than 0.5% |
|||||
8. Do you think the Republicans in Congress or the Democrats in Congress would do a better job of dealing with the issue of corruption in government?
|
|
|
|
NO |
No |
|
% |
% |
% |
% |
|
|
2006 Jan 6-8 |
32 |
44 |
19 |
6 |
|
|
|
|
|
|
|
2005 Oct 21-23 ^ |
33 |
44 |
18 |
5 |
|
|
|
|
|
|
|
^ Asked in a rotation with other issues |
||||
|
(vol.) = Volunteered response |
||||
9. I'd like to ask you about your member of Congress. Would you say that your member of Congress is [RANDOM ORDER]? Next, is your member [ITEM INSERTED]?
10. I'd like to ask you about most members of Congress. Would you say that most members of Congress are [RANDOM ORDER]? Next, are most members [ITEM INSERTED]?
A. Corrupt or not corrupt
|
|
Cor- |
Not |
No |
|
Cor- |
Not |
No |
|
Your member |
|
|
|
Most members |
|
|
|
|
2006 Jan 6-8 |
22% |
68 |
10 |
2006 Jan 6-8 |
38% |
55 |
7 |
|
|
|
|
|
|
|
||
|
1994 Oct 22-24 |
27% |
65 |
8 |
1994 Oct 22-24 |
50% |
44 |
6 |
B. Focused on the needs of special interests, or focused on the needs of the constituents in your district
|
|
Spe- |
Con- |
No |
|
Spe- |
Con- |
No |
|
Your member |
|
|
|
Most members |
|
|
|
|
2006 Jan 6-8 |
40% |
49 |
11 |
2006 Jan 6-8 |
54% |
40 |
6 |
|
|
|
|
|
|
|
||
|
1994 Oct 22-24 |
42% |
47 |
11 |
1994 Oct 22-24 |
58% |
37 |
5 |
C. Generally out of touch with average Americans or generally in touch
|
|
Out |
In |
No |
|
Out |
In |
No |
|
Your member |
Most members |
||||||
|
2006 Jan 6-8 |
38% |
58 |
5 |
2006 Jan 6-8 |
69% |
28 |
2 |
|
|
|
|
|
|
|
||
|
1994 Oct 22-24 |
41% |
54 |
5 |
1994 Oct 22-24 |
75% |
23 |
2 |
12. As you may know, a prominent lobbyist named Jack Abramoff admitted that he provided gifts to members of Congress in exchange for official favors. How closely have you been following the news about this case -- very closely, somewhat closely, not too closely, or not at all?
|
|
Very |
Some- |
Not too |
Not |
No |
|
2006 Jan 6-8 |
17% |
34 |
24 |
25 |
* |
|
* Less than 0.5% |
|||||
13. Do you think the Abramoff case is -- a major scandal, a minor scandal, or not a serious matter?
BASED ON 498 NATIONAL ADULTS IN FORM A
|
|
Major |
Minor |
Not a |
No |
|
2006 Jan 6-8 |
53% |
30 |
9 |
8 |
14. Just your best guess, which party will be hurt the most as the details of the Abramoff case are revealed -- [ROTATED: the Republicans (or) the Democrats], or will both parties be hurt equally?
BASED ON 505 NATIONAL ADULTS IN FORM B
|
|
Republicans |
Democrats |
Both |
NEITHER |
No |
|
2006 Jan 6-8 |
38% |
6 |
43 |
* |
13 |
|
(vol.) = Volunteered response |
|||||
|
* Less than 0.5% |
|||||