PRINCETON, NJ -- President Bush has been touting the progress in the U.S. economy this week, and the new head of the Federal Reserve, Benjamin Bernanke, gave generally positive views on economic conditions in the country in his testimony on Capitol Hill. The Dow Jones average has been above 11,000; in January, housing starts were more robust than expected; and reports on retail spending were also more positive than expected.
Despite the positive nature of these so-called "hard" economic indicators, however, the attitudes of the average American consumer toward the economy remain relatively dour. Majorities of Americans rate economic conditions at the moment as "only fair" or "poor," say economic conditions in the United States are getting worse, and say now is a bad time to be looking for a quality job. It is hard to determine precisely what criteria Americans are using for these judgments, particularly since a majority also say that the most important problems facing the country today are non-economic in nature.
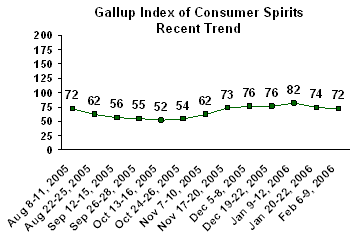
Gallup Index of Consumer Spirits
A useful way to summarize Gallup's measurements of public confidence in the economy is the Gallup Index of Consumer Spirits. This index, discussed in detail in "Consumer Confidence Remains on the Mend" (see Related Items), is based on the percentage of Americans rating the economy as "excellent" or "good" added to the percentage who say economic conditions in this country are "getting better."
The current reading on this index -- based on Gallup's latest Feb. 6-9, 2006, poll -- is 72. The trend line on the index shows a slight improvement at the end of 2005 and in the first Gallup Poll of 2006, but a slide back to slightly below late November and December levels in the most recent two polls. Keeping in mind that an index of 100 would represent half of Americans giving a positive response on each question (with 200 being the theoretical maximum), it can be seen that the current economic mood is not at all ebullient.

The major change from 2005 was the drop that accompanied the spike in gas prices at the time of Hurricane Katrina in the late summer and early fall. Last year began with a more positive 89 reading on this index.
So what does this mean? Americans are not showing much economic positivity on a relative basis. Ratings of the current economy and the direction of the economy remain improved from the trough encountered in the late summer and early fall 2005, but are now slightly less positive than was the case as 2005 began.

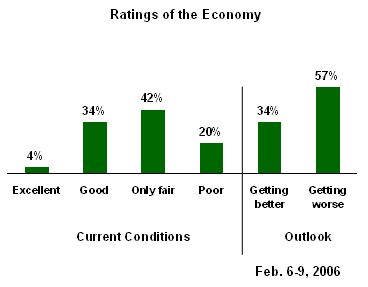
A clear majority of Americans assess the current state of the economy as being in one of the bottom two categories (only "fair" or "poor") and a majority chose the "getting worse" label when asked about the direction of the economy rather than the "getting better" label.
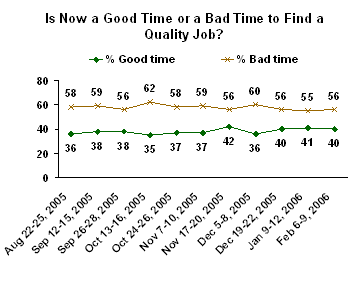
Additionally, Gallup data indicate that Americans are not very positive about the job market. Asked if now is a good time or a bad time to find a quality job, 40% of Americans say good, while a majority of 56% say bad.
This has not changed in recent months. A majority of Americans have indicated that it's a bad time to find a job every time Gallup has asked this question, going back to the summer of 2001, although the percentage saying it is a bad time to find a job has fallen somewhat over the last couple of years. There were two points in 2003 at which over 8 out of 10 Americans said that it was a bad time to find a quality job. Still, there has been little substantive change on this measure during the last year and it remains on balance in negative territory.

An additional clue to what's behind Americans' views of the economy is provided by the responses to a question Gallup asks every month: "What is the most important problem facing this country today?"
The results for February show that about 3 in 10 Americans mention some aspect of the economy as the nation's top problem. These responses range from 10% who say the economy in general, 7% who mention unemployment, 6% fuel and gas prices, 4% who say the Federal budget deficit, 2% who say a lack of money, to 1% who mention each of a variety of other economic issues: the high cost of living, the gap between the rich and the poor, taxes, and foreign trade.
Still, the significant majority of Americans indicate that the most important problem is something that doesn't directly have to do with the economy: Iraq (the single issue most frequently mentioned), dissatisfaction with government, terrorism, healthcare, morality and ethics, immigration, and education, to name a few.
In other words, Americans are not preoccupied with the economy to the extent that a majority immediately mention it as the nation's most pressing problem. This is a different situation than the case in 1992 and 1979 when the economy was widely recognized as struggling and was, in fact, the majority response to this question. Americans are negative about the nation's economy while, at the same time, the economy is not the predominant issue troubling Americans when asked to discuss the country's major problems.
The bottom line here: There are mixed perceptions. A majority of Americans do not rate the economy as excellent or good, and a majority do not say that it is getting better. At the same time, less than half say that aspects of the economy are the nation's top problem today.
What do you think is the most important problem facing this country today? [Open-ended]
|
Feb |
Jan |
Dec |
Nov |
Oct |
Sep |
Aug |
|
|
% |
% |
% |
% |
% |
% |
% |
|
|
ECONOMIC PROBLEMS (NET) |
29 |
29 |
26 |
28 |
36 |
32 |
32 |
|
Economy in general |
10 |
10 |
8 |
10 |
15 |
11 |
13 |
|
Unemployment/jobs |
7 |
7 |
6 |
5 |
5 |
4 |
8 |
|
Fuel/oil Prices |
6 |
5 |
4 |
6 |
7 |
8 |
8 |
|
Federal budget deficit/federal debt |
4 |
3 |
2 |
3 |
3 |
3 |
2 |
|
Lack of money |
2 |
1 |
2 |
1 |
1 |
2 |
1 |
|
High cost of living/inflation |
1 |
1 |
2 |
2 |
1 |
2 |
3 |
|
Gap between rich and poor |
1 |
1 |
1 |
* |
2 |
1 |
* |
|
Taxes |
1 |
1 |
2 |
1 |
1 |
1 |
1 |
|
Foreign trade/trade deficit |
1 |
* |
* |
* |
1 |
1 |
* |
|
Wage issues |
* |
1 |
1 |
1 |
* |
2 |
1 |
|
Corporate corruption |
* |
1 |
* |
1 |
* |
1 |
* |
|
Recession |
-- |
-- |
* |
-- |
* |
* |
-- |
|
|
|
|
|
|
|
|
|
|
NON-ECONOMIC PROBLEMS (NET) |
78 |
77 |
78 |
75 |
70 |
71 |
78 |
|
Situation in Iraq/war |
22 |
23 |
22 |
23 |
21 |
16 |
27 |
|
Dissatisfaction with government/ Congress/politicians/candidates; Poor leadership; corruption |
10 |
9 |
12 |
9 |
9 |
9 |
7 |
|
Terrorism |
9 |
7 |
6 |
6 |
5 |
6 |
10 |
|
Poor healthcare/hospitals; high cost of healthcare |
9 |
6 |
5 |
5 |
4 |
3 |
8 |
|
Ethics/moral/religious/family decline; dishonesty; lack of integrity |
6 |
7 |
7 |
6 |
5 |
7 |
6 |
|
Immigration/illegal aliens |
5 |
3 |
5 |
5 |
2 |
2 |
5 |
|
Education/poor education/access to education |
4 |
5 |
3 |
4 |
3 |
3 |
5 |
|
Foreign aid/focus overseas |
3 |
3 |
2 |
3 |
4 |
3 |
2 |
|
National security |
3 |
3 |
1 |
3 |
2 |
4 |
3 |
|
Poverty/ hunger/ homelessness |
3 |
4 |
5 |
4 |
4 |
4 |
5 |
|
Lack of energy sources; the energy crisis |
2 |
1 |
2 |
2 |
4 |
2 |
2 |
|
Medicare |
2 |
1 |
1 |
1 |
1 |
* |
1 |
|
Lack of respect for each other |
2 |
1 |
1 |
2 |
1 |
2 |
1 |
|
Social Security |
2 |
1 |
2 |
1 |
1 |
1 |
3 |
|
Judicial system/courts/laws |
1 |
2 |
1 |
1 |
1 |
1 |
2 |
|
International issues/problems |
1 |
2 |
1 |
1 |
1 |
1 |
2 |
|
Drugs |
1 |
* |
1 |
* |
1 |
* |
2 |
|
Crime/violence |
1 |
1 |
1 |
1 |
1 |
-- |
2 |
|
Abortion |
1 |
1 |
* |
1 |
* |
* |
1 |
|
Children's behavior/way they are raised |
1 |
1 |
1 |
* |
* |
* |
2 |
|
Natural disaster relief effort and funding |
1 |
1 |
1 |
3 |
6 |
13 |
-- |
|
Abuse of power |
1 |
* |
* |
* |
-- |
* |
* |
|
Unifying the country |
1 |
1 |
1 |
1 |
1 |
1 |
1 |
|
The media |
1 |
1 |
1 |
* |
1 |
* |
* |
|
Environment/pollution |
1 |
1 |
1 |
* |
1 |
1 |
1 |
|
Care for the elderly |
* |
* |
* |
* |
* |
* |
* |
|
Welfare |
* |
* |
* |
* |
1 |
1 |
1 |
|
Race relations/racism |
* |
1 |
1 |
1 |
1 |
1 |
* |
|
Overpopulation |
* |
-- |
-- |
* |
-- |
* |
-- |
|
Lack of military defense |
* |
* |
-- |
* |
* |
1 |
-- |
|
Election year/presidential choices/election reform |
* |
* |
* |
* |
-- |
* |
* |
|
Homosexuality/gay issues |
* |
-- |
* |
* |
* |
* |
* |
|
Child abuse |
-- |
-- |
* |
-- |
* |
* |
* |
|
Guns/gun control |
-- |
-- |
* |
-- |
* |
-- |
-- |
|
Space exploration /NASA |
-- |
-- |
-- |
-- |
* |
-- |
* |
|
|
|
|
|
|
|
|
|
|
Other non-economic |
2 |
3 |
3 |
3 |
4 |
2 |
5 |
|
No opinion |
2 |
2 |
2 |
4 |
1 |
3 |
3 |
|
* Less than 0.5% |
|||||||
Survey Methods
These results are based on telephone interviews with a randomly selected national sample of 1,002 adults, aged 18 and older, conducted Feb. 6-9, 2006. For results based on this sample, one can say with 95% confidence that the maximum error attributable to sampling and other random effects is ±3 percentage points. In addition to sampling error, question wording and practical difficulties in conducting surveys can introduce error or bias into the findings of public opinion polls.
How would you rate economic conditions in this country today -- as excellent, good, only fair, or poor?
|
|
|
|
|
No |
|
|
% |
% |
% |
% |
% |
|
|
2006 |
|
|
|
|
|
|
2006 Feb 6-9 |
4 |
34 |
42 |
20 |
* |
|
|
|
|
|
|
|
|
2006 Jan 20-22 |
5 |
34 |
41 |
18 |
1 |
|
2006 Jan 9-12 |
8 |
35 |
37 |
18 |
1 |
|
2005 |
|
|
|
|
|
|
2005 Dec 19-22 |
6 |
33 |
39 |
22 |
* |
|
2005 Dec 5-8 |
6 |
31 |
43 |
20 |
* |
|
2005 Nov 17-20 |
5 |
32 |
39 |
24 |
* |
|
2005 Nov 7-10 |
3 |
29 |
47 |
21 |
* |
|
2005 Oct 24-26 |
3 |
26 |
45 |
25 |
1 |
|
2005 Oct 13-16 |
3 |
25 |
46 |
26 |
* |
|
2005 Sep 26-28 |
3 |
28 |
41 |
27 |
1 |
|
2005 Sep 12-15 |
3 |
28 |
44 |
25 |
* |
|
2005 Aug 22-25 |
4 |
30 |
42 |
24 |
* |
|
2005 Aug 8-11 |
4 |
32 |
46 |
18 |
* |
|
2005 Jul 25-28 |
4 |
28 |
44 |
23 |
1 |
|
2005 Jul 7-10 |
3 |
33 |
45 |
18 |
1 |
|
2005 Jun 16-19 |
4 |
33 |
40 |
23 |
* |
|
2005 Jun 6-8 |
4 |
31 |
45 |
20 |
* |
|
2005 May 23-26 |
3 |
37 |
41 |
19 |
* |
|
2005 May 2-5 |
1 |
30 |
44 |
25 |
* |
|
2005 Apr 18-21 |
2 |
29 |
44 |
24 |
1 |
|
2005 Apr 4-7 |
3 |
29 |
49 |
18 |
1 |
|
2005 Mar 21-23 |
2 |
30 |
43 |
24 |
1 |
|
2005 Mar 7-10 |
3 |
32 |
48 |
16 |
1 |
|
2005 Feb 21-24 |
5 |
33 |
42 |
20 |
* |
|
2005 Feb 7-10 |
3 |
37 |
44 |
16 |
* |
|
2005 Jan 3-5 |
3 |
38 |
42 |
17 |
* |
|
* Less than 0.5% |
|||||
Right now, do you think that economic conditions in the country as a whole are getting better or getting worse?
|
Getting |
Getting |
SAME |
No opinion |
|
|
% |
% |
% |
% |
|
|
2006 |
|
|
|
|
|
(NA) 2006 Feb 6-9 |
34 |
57 |
7 |
3 |
|
|
|
|
|
|
|
(NA) 2006 Jan 20-22 |
35 |
54 |
7 |
3 |
|
(NA) 2006 Jan 9-12 |
39 |
52 |
7 |
2 |
|
2005 |
|
|
|
|
|
(NA) 2005 Dec 19-22 |
37 |
56 |
5 |
2 |
|
(NA) 2005 Dec 5-8 |
39 |
50 |
8 |
3 |
|
(NA) 2005 Nov 17-20 |
36 |
58 |
5 |
1 |
|
(NA) 2005 Nov 7-10 |
30 |
61 |
7 |
2 |
|
(NA) 2005 Oct 24-26 |
25 |
66 |
7 |
2 |
|
(NA) 2005 Oct 13-16 |
24 |
68 |
6 |
2 |
|
(NA) 2005 Sep 26-28 |
24 |
66 |
7 |
3 |
|
(NA) 2005 Sep 12-15 |
25 |
66 |
7 |
2 |
|
(NA) 2005 Aug 22-25 |
28 |
63 |
7 |
2 |
|
(NA) 2005 Aug 8-11 |
36 |
52 |
9 |
3 |
|
(NA) 2005 Jul 25-28 |
35 |
53 |
9 |
3 |
|
(NA) 2005 Jul 7-10 |
35 |
54 |
8 |
3 |
|
(NA) 2005 Jun 16-19 |
35 |
57 |
6 |
2 |
|
(NA) 2005 Jun 6-8 |
35 |
55 |
8 |
2 |
|
(NA) 2005 May 23-26 |
41 |
52 |
5 |
2 |
|
(NA) 2005 May 2-5 |
32 |
61 |
6 |
1 |
|
(NA) 2005 Apr 18-21 |
31 |
61 |
5 |
3 |
|
(NA) 2005 Apr 4-7 |
35 |
56 |
6 |
3 |
|
(NA) 2005 Mar 21-23 |
33 |
59 |
6 |
2 |
|
(NA) 2005 Mar 7-10 |
41 |
50 |
6 |
3 |
|
(NA) 2005 Feb 21-24 |
43 |
48 |
7 |
2 |
|
(NA) 2005 Feb 7-10 |
47 |
44 |
7 |
2 |
|
(NA) 2005 Jan 3-5 |
48 |
42 |
7 |
3 |
|
(vol.) = Volunteered response |
||||
