GALLUP NEWS SERVICE
PRINCETON, NJ -- Recent Gallup polling in the United States, Great Britain, and Canada indicates that American adults have a bigger weight problem than do the British or Canadians, with the difference especially pronounced among men. Many have weighed in on the burgeoning obesity problem in all three countries, including Britain's Prince Charles, who blames lack of exercise in modern lifestyles. Gallup's exercise data cast some doubt on this thesis, though, suggesting diet may play the larger role.
Gallup conducted parallel surveys in Great Britain and Canada in December 2005, asking a number of weight- and exercise-related questions that were included in Gallup's annual Health survey from November 2005.
American Men Tip the Scales
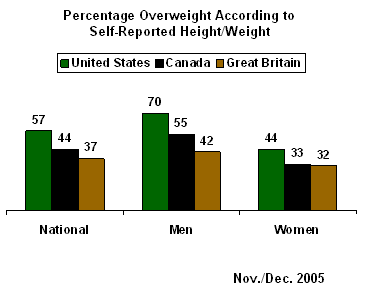
According to respondents' self-reported height and weight measurements, 70% of U.S. men are overweight, compared with 55% of men in Canada and 42% of men in Great Britain. By contrast, 44% of women in the United States are overweight, compared with 33% of women in Canada and 32% in Great Britain.

These percentages represent the number of people who can be classified as "overweight" or "obese" according to the standard Body Mass Index (BMI) calculation widely used in medical and government health research.
On average, American men are only an inch taller than men in Canada and Great Britain, but they weigh nearly 10 pounds more than Canadian men and nearly 15 pounds more than British men.
|
Gallup Poll-Based Weight Statistics -- 2005 |
|||
|
Men |
|||
|
United States |
Canada |
Great Britain |
|
|
|
|
|
|
|
% "Overweight" |
41% |
33% |
36% |
|
Average Height |
5'10" |
5'9" |
5'9" |
|
Average Weight |
193 lbs |
185 lbs |
179 lbs |
|
|
|
|
|
|
BMI |
% |
% |
% |
|
Obese |
23 |
15 |
9 |
|
Overweight |
47 |
40 |
33 |
|
Total overweight |
70 |
55 |
42 |
At five feet, five inches tall, American women are also an inch taller, on average, than women in Canada and Great Britain. They are 7 pounds heavier than Canadian women and 10 pounds heavier than British women.
|
Gallup Poll-Based Weight Statistics -- 2005 |
|||
|
Women |
|||
|
United States |
Canada |
Great Britain |
|
|
|
|
|
|
|
% "Overweight" |
44% |
37% |
40% |
|
Average Height |
5'5" |
5'4" |
5'4" |
|
Average Weight |
154 lbs |
147 lbs |
144 lbs |
|
|
|
|
|
|
BMI |
% |
% |
% |
|
Obese |
18 |
11 |
8 |
|
Overweight |
26 |
22 |
24 |
|
Total overweight |
44 |
33 |
32 |
Despite the considerable lead held by U.S. men in this weight comparison, they are only slightly more likely to say they are overweight (41%) than are men in Canada (33%) and Great Britain (36%).
Also, U.S. men are no more likely than U.S. women to consider themselves overweight. Just 41% of men vs. 44% of women say they are either very or somewhat overweight when asked to describe their personal weight situation.
By contrast, U.S. women are more sensitive to their weight relative to British and Canadian women.

Are Cars to Blame?
The obesity issue has sounded alarm bells in all three countries, as the average recorded weight of children and adults has soared over the past few decades. Britain's Prince Charles recently expressed concern that the British girth could soon catch up with the Americans'. He focused his corrective advice on the need for more physical activity in everyday living, blaming the automobile for replacing good old-fashioned walking and bicycling. Prince Charles opined:
"Research suggests that walking or cycling for just half an hour a day can have a significant improvement on our state of health. But why don't we do it more? Because our towns and cities make it nearly impossible, and because it might help if the built environment was more appealing and attractive to the pedestrian."
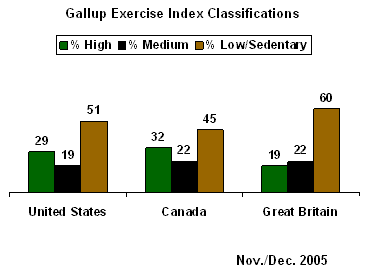
But according to Gallup data, lack of exercise does not appear to be the sole determinant of America's weight problem. In fact, U.S. adults are much more likely than the British to report being physically active. Only 19% of the British, compared with 29% of Americans and 32% of Canadians, are classified as highly active in Gallup's physical exercise index (this takes into account respondents' self-reported participation in vigorous or moderate exercise). Conversely, 60% of the British are classified as sedentary or exert low levels of exercise, compared with 51% of Americans and 45% of Canadians.

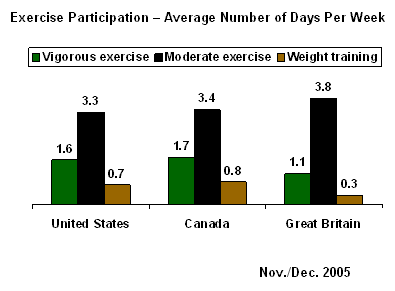
Residents of all three countries fall short of medical guidelines for participating in regular exercise. However, Americans are more active than the British on each dimension of the exercise index. For instance, Americans spend an average of 1.6 days per week participating in vigorous, heart-pumping sports or physical activities that last at least 20 minutes. The British, on average, spend only 1.1 days per week on such activities.
Americans spend an average of 3.3 days per week on moderate sports or recreational activities, such as walking and gardening. However, British men and women average 3.8 days per week engaging in moderate exercise.

Slight Eating Differences
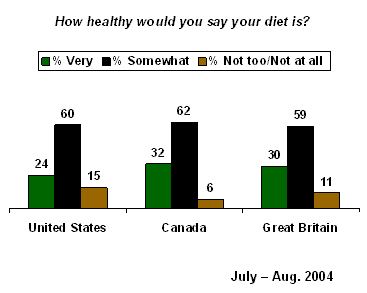
Perhaps the answer lies more in eating habits. One-quarter of Americans (24%) told Gallup in July 2004 that their diet is "very healthy," compared with nearly one-third of adults in Great Britain (30%) and Canada (32%).

Whether that small difference could account for the rather substantial disparity in the prevalence of weight problems between the United States and the other two countries is not clear, but it does provide some food for thought.
Smoking can also be a relevant lifestyle factor regarding weight, but does not seem to explain the higher weight of Americans compared with the British and Canadians. Although Gallup finds that the British are more likely than Americans to smoke cigarettes (30% to 25%) and might therefore be predicted to have a lower weight on average, the prevalence of smoking in Canada is the same as in the United States.
Survey Methods
Results in the United States are based on telephone interviews with 1,011 national adults, aged 18 and older, conducted Nov. 7-10, 2005. For results based on the total sample of national adults, one can say with 95% confidence that the maximum margin of sampling error is ±3 percentage points. The survey was conducted by Gallup USA.
Results in Canada are based on telephone interviews with 1,003 national adults, aged 18 and older, conducted Dec. 12-18, 2005. For results based on the total sample of national adults, one can say with 95% confidence that the maximum margin of sampling error is ±3 percentage points. The survey was conducted by Gallup Canada.
Results in Great Britain are based on telephone interviews with 1,010 national adults, aged 18 and older, conducted Dec. 12-20, 2005. For results based on the total sample of national adults, one can say with 95% confidence that the maximum margin of sampling error is ±3 percentage points. The survey was conducted by Gallup UK.
In addition to sampling error, question wording and practical difficulties in conducting surveys can introduce error or bias into the findings of public opinion polls.
26. How would you describe your own personal weight situation right now -- very overweight, somewhat overweight, about right, somewhat underweight, or very underweight?
|
|
Some-what over-weight |
|
Some-what under-weight |
|
|
|
|
United States |
% |
% |
% |
% |
% |
% |
|
2005 Nov 7-10 |
5 |
37 |
53 |
4 |
1 |
* |
|
2004 Jul 8-11 |
5 |
39 |
50 |
5 |
1 |
* |
|
|
|
|
|
|
|
|
|
Canada |
|
|
|
|
|
|
|
2005 Dec 12-18 |
3 |
32 |
59 |
5 |
1 |
* |
|
2004 Aug 30-Sep 6 |
3 |
36 |
56 |
4 |
1 |
-- |
|
|
|
|
|
|
|
|
|
Great Britain |
|
|
|
|
|
|
|
2005 Dec 12-20 |
2 |
35 |
56 |
6 |
1 |
-- |
|
2004 Aug 25-Sep 7 |
3 |
33 |
57 |
5 |
1 |
-- |
|
* Less than 0.5% |
||||||
27. What is your approximate current weight?
|
124 lbs. or less |
125-149 lbs. |
150-174 lbs. |
175-199 lbs. |
200 lbs. and over |
No opinion |
Average weight |
|
|
United States |
% |
% |
% |
% |
% |
% |
|
|
2005 Nov 7-10 |
9 |
19 |
24 |
19 |
25 |
4 |
173 |
|
|
|
|
|
|
|
|
|
|
Canada |
|
|
|
|
|
|
|
|
2005 Dec 12-18 |
12 |
25 |
25 |
19 |
15 |
3 |
166 |
|
|
|
|
|
|
|
|
|
|
Great Britain |
|
|
|
|
|
|
|
|
2005 Dec 12-20 |
11 |
24 |
26 |
16 |
12 |
11 |
161 |
28. What is your approximate current height?
|
|
|
|
|
|
|
6'4" or taller |
|
|
|
|
United States |
% |
% |
% |
% |
% |
% |
% |
% |
|
|
2005 Nov 7-10 |
4 |
16 |
24 |
16 |
21 |
17 |
2 |
* |
5'7" |
|
|
|
|
|
|
|
|
|
|
|
|
Canada |
|
|
|
|
|
|
|
|
|
|
2005 Dec 12-18 |
5 |
20 |
23 |
17 |
24 |
9 |
-- |
2 |
5'6" |
|
|
|
|
|
|
|
|
|
|
|
|
Great Britain |
|
|
|
|
|
|
|
|
|
|
2005 Dec 12-20 |
7 |
20 |
23 |
16 |
20 |
7 |
1 |
6 |
5'6" |
|
* Less than 0.5% |
|||||||||
BODY MASS INDEX (Q.27-28)
|
< 20 (under-weight) |
|
26-30 |
|
|
|
|
|
|
United States |
% |
% |
% |
% |
% |
|
|
|
2005 Nov 7-10 |
7 |
32 |
36 |
21 |
4 |
27 |
26 |
|
|
|
|
|
|
|
|
|
|
Canada |
|
|
|
|
|
|
|
|
2005 Dec 12-18 |
5 |
46 |
31 |
13 |
5 |
26 |
25 |
|
|
|
|
|
|
|
|
|
|
Great Britain |
|
|
|
|
|
|
|
|
2005 Dec 12-20 |
7 |
44 |
28 |
9 |
12 |
25 |
25 |
|
|
|
|
|
|
|
|
|
|
NOTE: Body Mass Index is a ratio of one's weight to their height. It is calculated as a person's weight (in kilograms) divided by their height (in meters) squared. |
|||||||
29. Generally, how many days per week do you participate in each of the following activities -- or do you participate less than once a week or not at all? How about -- [ROTATED]?
A. Vigorous sports or physical activities for at least 20 minutes that cause large increases in breathing or heart rate
|
|
Less than once |
|
|
|
|
|
|
|
|
|
United States |
% |
% |
% |
% |
% |
% |
% |
|
|
|
2005 Nov 7-10 |
49 |
3 |
18 |
16 |
8 |
5 |
1 |
1.6 |
0 |
|
2003 Nov 3-5 |
46 |
5 |
18 |
17 |
8 |
5 |
1 |
1.6 |
0 |
|
|
|
|
|
|
|
|
|
|
|
|
Canada |
|
|
|
|
|
|
|
|
|
|
2005 Dec 12-18 |
40 |
5 |
22 |
20 |
9 |
3 |
1 |
1.7 |
0 |
|
2003 Dec 5-11 |
41 |
6 |
26 |
17 |
6 |
4 |
* |
-- |
-- |
|
|
|
|
|
|
|
|
|
|
|
|
Great Britain |
|
|
|
|
|
|
|
|
|
|
2005 Dec 12-20 |
58 |
2 |
22 |
11 |
4 |
3 |
* |
1.1 |
0 |
|
2003 Dec 2-21 |
56 |
4 |
19 |
12 |
3 |
5 |
-- |
-- |
-- |
|
* Less than 0.5% |
|||||||||
B. Moderate sports or recreational activities that cause slight increases in breathing or heart rate, such as walking, gardening, or other similar activities
|
|
Less than once |
|
|
|
|
|
|
|
|
|
United States |
% |
% |
% |
% |
% |
% |
% |
|
|
|
2005 Nov 7-10 |
14 |
2 |
25 |
26 |
15 |
17 |
1 |
3.3 |
3 |
|
2003 Nov 3-5 |
16 |
3 |
27 |
25 |
16 |
14 |
* |
3.1 |
3 |
|
|
|
|
|
|
|
|
|
|
|
|
Canada |
|
|
|
|
|
|
|
|
|
|
2005 Dec 12-18 |
10 |
3 |
26 |
28 |
16 |
16 |
1 |
3.4 |
3 |
|
2003 Dec 5-11 |
11 |
4 |
27 |
26 |
15 |
17 |
* |
-- |
-- |
|
|
|
|
|
|
|
|
|
|
|
|
Great Britain |
|
|
|
|
|
|
|
|
|
|
2005 Dec 12-20 |
14 |
2 |
22 |
19 |
13 |
30 |
* |
3.8 |
3 |
|
2003 Dec 2-21 |
14 |
2 |
20 |
20 |
9 |
35 |
-- |
-- |
-- |
|
* Less than 0.5% |
|||||||||
C. Weight lifting or weight training
|
|
Less than once |
|
|
|
|
|
|
|
|
|
United States |
% |
% |
% |
% |
% |
% |
% |
|
|
|
2005 Nov 7-10 |
72 |
3 |
12 |
10 |
2 |
1 |
* |
0.7 |
0 |
|
2003 Nov 3-5 |
71 |
2 |
11 |
10 |
4 |
2 |
* |
0.8 |
0 |
|
|
|
|
|
|
|
|
|
|
|
|
Canada |
|
|
|
|
|
|
|
|
|
|
2005 Dec 12-18 |
71 |
3 |
11 |
10 |
4 |
1 |
-- |
0.8 |
0 |
|
2003 Dec 5-11 |
73 |
5 |
11 |
7 |
3 |
1 |
-- |
-- |
-- |
|
|
|
|
|
|
|
|
|
|
|
|
Great Britain |
|
|
|
|
|
|
|
|
|
|
2005 Dec 12-20 |
87 |
1 |
6 |
4 |
1 |
1 |
* |
0.3 |
0 |
|
2003 Dec 2-21 |
81 |
3 |
7 |
6 |
2 |
1 |
-- |
-- |
-- |
|
* Less than 0.5% |
|||||||||
Total Exercise Index (Q.29A-B)
|
High |
Medium |
Low |
Sedentary |
Undesignated |
|
|
United States |
% |
% |
% |
% |
% |
|
2005 Nov 7-10 |
29 |
19 |
24 |
27 |
1 |
|
2003 Nov 3-5 |
30 |
18 |
22 |
29 |
1 |
|
|
|
|
|
|
|
|
Canada |
|
|
|
|
|
|
2005 Dec 12-18 |
32 |
22 |
22 |
23 |
-- |
|
2003 Dec 5-11 |
27 |
26 |
22 |
25 |
* |
|
|
|
|
|
|
|
|
Great Britain |
|
|
|
|
|
|
2005 Dec 12-20 |
19 |
22 |
34 |
26 |
-- |
|
2003 Dec 2-21 |
21 |
19 |
35 |
25 |
-- |
|
* Less than 0.5% |
|||||