GALLUP NEWS SERVICE
PRINCETON, NJ -- One of the great early predictions of the Internet was that e-commerce would transform the way people shop, eventually crippling brick-and-mortar retailing. That idea gained momentum along with the dot-com boom in the late 1990s. Online retail sales have been climbing by about 25% per year, according to the Commerce Department, so Internet shopping is far from dead. But it still only accounts for about 2% of all retail sales in the United States.
Gallup polling of Americans' online activities raises an important counterpoint to the evidence that Internet sales are growing. The percentage of Americans who regularly shop online is not growing. Thirty-six percent of U.S. adults in 2003 said they regularly shopped online, compared with 38% in 2005. The implication is that the Internet does not appear to be building its customer base. As a result, the increased sales volume is likely attributable to an increase in the amount of money that a fixed number of shoppers are spending online.
As in 2003, Gallup finds that Internet shoppers are wealthier than Internet users who rarely or never shop online. They are also more likely to be below retirement age. However beyond these income and age patterns, online shoppers look similar to the rest of the online universe.
Shopping Ranks Fairly High
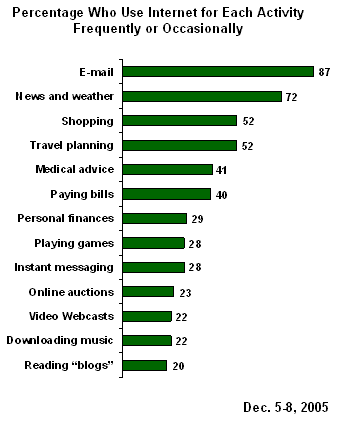
As part of Gallup's December 2005 Lifestyle survey, Internet users were asked how often they participate in each of 13 Internet activities ("frequently," "occasionally," "rarely," or "never"). Shopping ranks fairly high on the list, well below the dominant activities of using e-mail and checking news and weather, but tied with travel planning as a second-tier activity.
Shopping Trend Is Flat
Between December 2003 and December 2005, Gallup found a constant percentage of Americans -- about three-quarters -- using the Internet to any degree. Over the same period, the percentage of Internet users who use the Internet for shopping changed by only three percentage points, from 49% in 2003 to 52% in 2005. That is within the margin of error for comparing results between the two polls.
|
Percentage Who Do Activity Frequently/Occasionally |
|||
|
|
2003 |
2005 |
Change |
|
% |
% |
Pct. pts. |
|
|
Paying bills online |
29 |
40 |
+11 |
|
Making travel plans |
44 |
52 |
+8 |
|
Checking news and weather |
68 |
72 |
+4 |
|
Sending and reading e-mail |
84 |
87 |
+3 |
|
Shopping |
49 |
52 |
+3 |
|
Finding medical advice |
38 |
41 |
+3 |
|
Budgeting personal finances |
26 |
29 |
+3 |
|
Playing games |
31 |
28 |
-3 |
|
Using instant messaging |
34 |
28 |
-6 |
Convenience Sells
At the same time, one aspect of shopping online -- making travel arrangements -- has grown some. Fifty-two percent of online users say they frequently or occasionally makes travel plans online, up from 44% in 2003.
The increased use of the Internet for making travel arrangements could be part of a larger trend of people increasingly using the Internet for those things that save them time. The only other activity for which Gallup finds significant increased participation since 2003 -- paying bills online -- shares this quality.
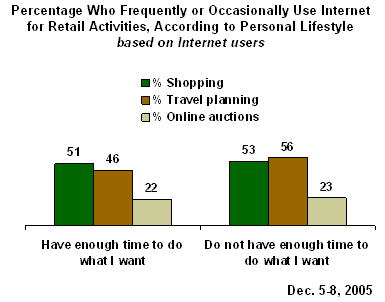
Internet users who say they do not have enough time to do the things they want in life are somewhat more likely than those who say they do have enough time to use the Internet for making travel plans (56% vs. 46%). Time constraint is not a factor, however, in the rates of online shopping or participating in online auctions.
Income and Shopping
There is an important income component to Americans' Internet use. The likelihood of being online to any degree increases according to household income. Beyond that, the amount of time people spend online increases proportionally with their household income. (Upper-income Americans may be more likely to have jobs that require going online, and may be more likely to be connected to the Internet at home.)
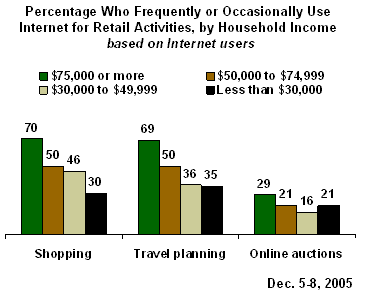
Perhaps as a result of different rates of connectivity, upper-income Americans are more likely to engage in a variety of Internet activities -- e-mailing, surfing for news and weather, and paying bills. However, the gap between low-income and high-income Internet users tends to be even higher for activities that involve spending money.
Gallup sees this in the reported rates of using the Internet for shopping, generally, and for making travel plans. However, the discounts and value offered by online auctions such as eBay results in more equal use. High-income Americans are still more likely to participate in online auctions, but not to as great as an extent as is seen for shopping, generally.
Other Demographic Factors
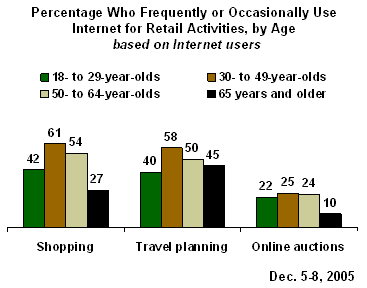
The only other major demographic factor related to online shopping, besides household income, is age -- with the dividing point being retirement age.
Within the online universe, adults aged 64 and younger are more likely than those aged 65 and older to shop online and participate in online auctions. However, there is no difference by age in use of the Internet for making travel arrangements. (Although the sample sizes for some of these age groups are small, highly similar results by age were seen in 2003, which strengthens the validity of the finding.)
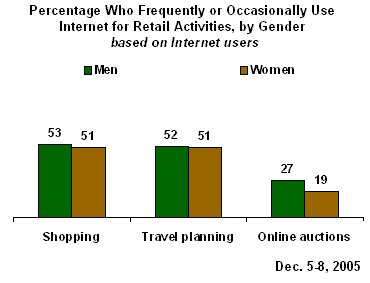
Men and women are equally likely to use the Internet for shopping and making travel plans. However men are somewhat more likely than women to participate in online auctions (27% of men vs. 19% of women do this frequently or occasionally).
Online Shopping in Context
It is not just online shopping that suffers from anemic growth: Americans' likelihood of doing most of the other Internet activities has not changed during the past two years. As reported in a Feb. 6, 2005, Gallup news article, of the nine activities measured in December 2003, the only notable differences are modest increases in the percentages using the Internet for making travel arrangements and paying bills, and a slight decline in the percentage using instant messaging.
It appears the online public is simply doing more of the same activities, rather than branching out and trying different Internet offerings. It is within this broader context of set habits that online retailers must compete for shoppers.
Survey Methods
These results are based on telephone interviews with a randomly selected national sample of 1,013 adults, aged 18 and older, conducted Dec. 5-8, 2005. For results based on the total sample, one can say with 95% confidence that the maximum error attributable to sampling and other random effects is ±3 percentage points. For results based on the sample of 759 Internet users, the maximum margin of sampling error is ±4 percentage points.
In addition to sampling error, question wording and practical difficulties in conducting surveys can introduce error or bias into the findings of public opinion polls.
25. How much time, if at all, do you personally spend using the Internet -- more than an hour a day, up to one hour a day, a few times a week, a few times a month or less, or never?
|
|
More than |
|
|
A few |
Never |
No |
|
% |
% |
% |
% |
% |
% |
|
|
2005 Dec 5-8 |
33 |
18 |
13 |
9 |
27 |
* |
|
|
|
|
|
|
|
|
|
2004 Dec 5-8 |
32 |
16 |
19 |
8 |
25 |
* |
|
2003 Dec 11-14 |
27 |
20 |
15 |
10 |
27 |
1 |
|
2002 Dec 5-8 |
26 |
16 |
18 |
12 |
28 |
* |
|
* Less than 0.5% |
||||||
26. How often do you, yourself, use the Internet to do the following -- frequently, occasionally, rarely, or never? How about for -- [RANDOM ORDER]?
BASED ON 759 INTERNET USERS
C. Shopping
|
|
Frequently |
Occasionally |
Rarely |
Never |
No opinion |
|
|
|
|
|
|
|
|
2005 Dec 5-8 ^ |
18% |
34 |
19 |
29 |
* |
|
|
|
|
|
|
|
|
2003 Dec 11-14 ^ |
15% |
34 |
20 |
31 |
-- |
|
|
|
|
|
|
|
|
^Based on Internet users |
|||||
|
Internet Activities Summary Table |
||||
|
2005 Dec 5-8 |
Frequently |
Frequently/ |
EVER |
Never |
|
% |
% |
% |
% |
|
|
Sending and reading e-mail |
67 |
87 |
93 |
7 |
|
Checking news and weather |
45 |
72 |
83 |
17 |
|
Shopping |
18 |
52 |
71 |
29 |
|
Making travel plans |
19 |
52 |
71 |
29 |
|
Finding medical advice |
10 |
41 |
68 |
32 |
|
Paying bills online |
27 |
40 |
50 |
50 |
|
Budgeting personal finances |
17 |
29 |
41 |
58 |
|
Playing games |
16 |
28 |
44 |
56 |
|
Using instant messaging |
16 |
28 |
42 |
58 |
|
Buying or selling products in online auctions |
7 |
23 |
40 |
60 |
|
Watching video Webcasts |
8 |
22 |
40 |
60 |
|
Downloading music |
10 |
22 |
34 |
66 |
|
Reading "blogs" |
9 |
20 |
33 |
66 |

