GALLUP NEWS SERVICE
PRINCETON, NJ -- A recent Gallup Poll finds a slight increase in Americans' satisfaction with the way things are going in the country at the present time, though, from an overall perspective, the vast majority of Americans still remain dissatisfied. The public's current level of satisfaction remains well below the national average across Gallup's historical data on this measure, and is also lower than it was earlier in this year. When asked to name, without prompting, the most important problem facing the country right now, Americans say the war in Iraq, immigration, fuel and oil prices, the general state of the economy, and government dissatisfaction are the most important. Since May, there has been a decline in concerns about gas prices and a slight increase in concerns about immigration.
Mood of the Nation
The latest poll, conducted June 1-4, 2006, finds that 30% of Americans say they are satisfied with the way things are going in the country right now, while 67% are dissatisfied. The public's overall level of satisfaction is up five points from last month. However, satisfaction levels remain in very negative territory -- lower than earlier this year and at any point since the mid-1990s.
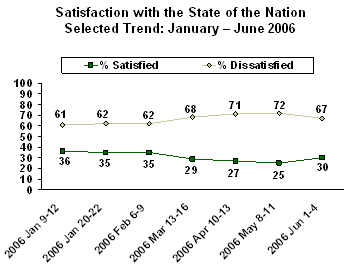
The slight increase in this month's measure comes primarily among Republicans, up from 50% in May to 56% in June, and independents, up from 19% to 27%. Only about 1 in 10 Democrats expressed satisfaction in both surveys.
The current 30% satisfaction reading is below average for the 26-year period in which Gallup has been using this measure. Since 1979, the average percentage of Americans saying they are satisfied has been 44%. The high point in satisfaction came in February 1999 when 71% of Americans say they were satisfied. The first survey on this measure, conducted July 1979, found satisfaction at 12%, the lowest ever measured, although not much below the 14% measured in June 1992.
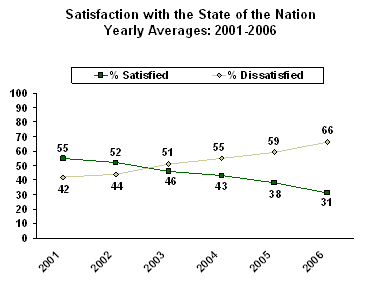
In more recent years, since President George W. Bush took office in 2001, the trends in satisfaction have shown a gradual year-to-year decline. In 2001, an average of 55% of Americans said they were satisfied with the way things were going in the country. This sentiment then began to decline, dropping to 52% in 2002, to 46% in 2003, 43% in 2004, 38% in 2005, and to an average of 31% so far this year.
Most Important Problem
Gallup's June update on the long standing trend question that asks Americans to identify "the most important problem facing this country today" shows that Americans designate the war in Iraq as the top problem facing the country right now, mentioned by 27% of Americans. Following behind Iraq are immigration (18%), fuel and oil prices (11%), the general state of the economy (9%), dissatisfaction with government (8%), healthcare issues (7%), and ethics and morality (7%). Other issues mentioned include unemployment or jobs; the federal budget deficit; and poverty, hunger and homelessness.
|
What do you think is the most important problem facing this country today? |
|
|
% |
|
|
ECONOMIC PROBLEMS (NET) |
31 |
|
Fuel/oil prices |
11 |
|
Economy in general |
9 |
|
Unemployment/jobs |
4 |
|
Federal budget deficit/federal debt |
4 |
|
High cost of living/inflation |
2 |
|
Taxes |
2 |
|
Corporate corruption |
1 |
|
Gap between rich and poor |
1 |
|
Lack of money |
1 |
|
Wage issues |
* |
|
Foreign trade/trade deficit |
* |
|
Recession |
-- |
|
|
|
|
NON-ECONOMIC PROBLEMS (NET) |
80 |
|
Situation in Iraq/war |
27 |
|
Immigration/illegal aliens |
18 |
|
Dissatisfaction with government/Congress/ |
8 |
|
Poor healthcare/hospitals; high cost of health care |
7 |
|
Ethics/moral/religious/family decline; |
7 |
|
Poverty/hunger/homelessness |
4 |
|
National security |
3 |
|
Terrorism |
3 |
|
Foreign aid/focus overseas |
3 |
|
Education/poor education/access to education |
3 |
|
Lack of energy sources; the energy crisis |
3 |
|
Lack of respect for each other |
2 |
|
Environment/pollution |
2 |
|
Social Security |
2 |
|
International issues/problems |
2 |
|
Crime/violence |
1 |
|
Judicial system/courts/laws |
1 |
|
Unifying the country |
1 |
|
Natural disaster relief effort and funding |
1 |
|
Drugs |
1 |
|
Medicare |
1 |
|
Welfare |
1 |
|
The media |
1 |
|
Abuse of power |
1 |
|
Children's behavior/way they are raised |
1 |
|
Abortion |
* |
|
Care for the elderly |
* |
|
Homosexuality/gay issues |
* |
|
Child abuse |
* |
|
Lack of military defense |
* |
|
Election year/presidential choices/election reform |
* |
|
Race relations/racism |
* |
|
Guns/gun control |
-- |
|
Overpopulation |
-- |
|
Other non-economic |
3 |
|
|
|
|
No opinion |
4 |
|
|
|
|
Total |
146% |
|
|
|
|
* Less than 0.5% |
|
|
Percentages add to more than 100% due to multiple responses. |
|
There have been several changes on this measure in recent months worth noting:
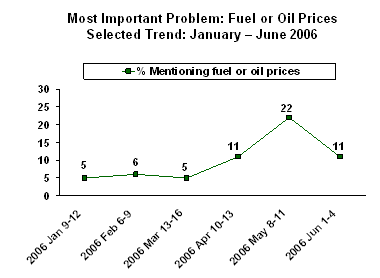
- The percentage of Americans who name energy (the price of gas, shortage of energy, etc.) as the most important problem facing the country declined significantly this month, down from 22% in May to 11% now. The latest results are the same as Gallup measured in April, and are still much higher than measured earlier this year.
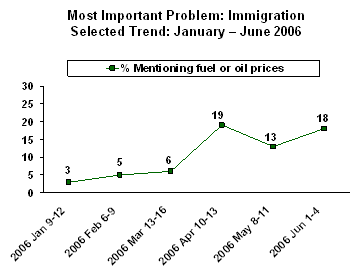
- Currently, 18% of Americans say immigration is the top problem facing the country. This percentage is up from 13% last month, but is essentially the same as Gallup observed in April. Less than 1 in 10 Americans mentioned immigration at the beginning of the year.
- Gallup has also found some modest fluctuation in the percentage of Americans mentioning the situation in Iraq as the most important problem. Since April, at least one in four Americans mentioned Iraq; earlier in the year, this percentage ranged between 20% and 23%. Still, in every survey taken this year, Iraq has been at the top of the list when Americans are asked to name the most important problem facing the country.
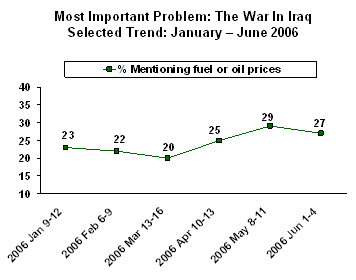
None of the other issues mentioned in response to this question have shown significant change since the start of the year.
Survey Methods
Results are based on telephone interviews with 1,002 national adults, aged 18 and older, conducted June 1-4, 2006. For results based on the total sample of national adults, one can say with 95% confidence that the margin of sampling error is ±3 percentage points. In addition to sampling error, question wording and practical difficulties in conducting surveys can introduce error or bias into the findings of public opinion polls.
In general, are you satisfied or dissatisfied with the way things are going in the United States at this time?
|
Satisfied |
Dis- |
No |
|
|
% |
% |
% |
|
|
2006 |
|
|
|
|
2006 Jun 1-4 |
30 |
67 |
2 |
|
2006 May 8-11 |
25 |
72 |
3 |
|
2006 Apr 10-13 |
27 |
71 |
2 |
|
2006 Mar 13-16 |
29 |
68 |
2 |
|
2006 Feb 6-9 |
35 |
62 |
3 |
|
2006 Jan 20-22 |
35 |
62 |
3 |
|
2006 Jan 9-12 |
36 |
61 |
3 |
|
|
|
|
|
|
2005 |
|
|
|
|
2005 Dec 19-22 |
36 |
62 |
2 |
|
2005 Dec 5-8 |
35 |
62 |
3 |
|
2005 Nov 17-20 |
36 |
62 |
2 |
|
2005 Nov 7-10 |
31 |
66 |
3 |
|
2005 Oct 24-26 |
35 |
63 |
2 |
|
2005 Oct 13-16 |
31 |
68 |
1 |
|
2005 Sep 26-28 |
39 |
59 |
2 |
|
2005 Sep 12-15 |
34 |
65 |
1 |
|
2005 Aug 22-25 |
34 |
62 |
4 |
|
2005 Aug 8-11 |
37 |
60 |
3 |
|
2005 Jul 25-28 |
40 |
58 |
2 |
|
2005 Jul 7-10 |
42 |
57 |
1 |
|
2005 Jun 16-19 |
42 |
56 |
2 |
|
2005 Jun 6-8 |
38 |
60 |
2 |
|
2005 May 23-26 |
41 |
55 |
4 |
|
2005 May 2-5 |
39 |
58 |
3 |
|
2005 Apr 4-7 |
38 |
59 |
3 |
|
2005 Mar 21-23 |
38 |
59 |
3 |
|
2005 Mar 7-10 |
42 |
56 |
2 |
|
2005 Feb 21-24 |
45 |
52 |
3 |
|
2005 Feb 7-10 |
46 |
52 |
2 |
|
2005 Jan 3-5 |
46 |
53 |
1 |
|
|
|
|
|
|
2004 |
|
|
|
|
2004 Dec 5-8 |
45 |
53 |
2 |
|
2004 Nov 7-10 |
44 |
54 |
2 |
|
2004 Oct 29-31 |
44 |
53 |
3 |
|
2004 Oct 11-14 |
41 |
57 |
2 |
|
2004 Sep 13-15 |
41 |
56 |
3 |
|
2004 Aug 9-11 |
44 |
55 |
1 |
|
2004 Jul 8-11 |
41 |
57 |
2 |
|
2004 Jun 3-6 |
39 |
59 |
2 |
|
2004 May 7-9 |
37 |
62 |
1 |
|
2004 May 2-4 |
36 |
62 |
2 |
|
2004 Apr 5-8 |
41 |
57 |
2 |
|
2004 Mar 8-11 |
39 |
60 |
1 |
|
2004 Feb 9-12 |
45 |
54 |
1 |
|
2004 Jan 12-15 |
46 |
53 |
1 |
|
2004 Jan 2-5 |
55 |
43 |
2 |
|
|
|
|
|
|
2003 |
|
|
|
|
2003 Dec 11-14 |
50 |
48 |
2 |
|
2003 Nov 3-5 |
44 |
54 |
2 |
|
2003 Oct 6-8 |
41 |
57 |
2 |
|
2003 Sep 8-10 |
40 |
58 |
2 |
|
2003 Aug 4-6 |
46 |
52 |
2 |
|
2003 Jul 7-9 |
50 |
48 |
2 |
|
2003 Jun 12-15 |
47 |
51 |
2 |
|
2003 May 5-7 |
54 |
45 |
1 |
|
2003 Apr 7-9 |
55 |
41 |
4 |
|
2003 Mar 22-23 |
60 |
38 |
2 |
|
2003 Mar 3-5 |
36 |
61 |
3 |
|
2003 Feb 17-19 |
39 |
58 |
3 |
|
2003 Feb 3-6 |
40 |
58 |
2 |
|
2003 Jan 13-16 |
42 |
56 |
2 |
|
|
|
|
|
|
2002 |
|
|
|
|
2002 Dec 5-8 |
46 |
51 |
3 |
|
2002 Nov 11-14 |
48 |
48 |
4 |
|
2002 Oct 31-Nov 3 |
48 |
47 |
5 |
|
2002 Oct 3-6 |
47 |
49 |
4 |
|
2002 Sep 5-8 |
47 |
51 |
2 |
|
2002 Aug 5-8 |
47 |
50 |
3 |
|
2002 Jul 26-28 |
48 |
49 |
3 |
|
2002 Jul 22-24 |
49 |
47 |
4 |
|
2002 Jul 9-11 |
49 |
48 |
3 |
|
2002 Jun 3-6 |
52 |
44 |
4 |
|
2002 May 6-9 |
56 |
40 |
4 |
|
2002 Apr 8-11 |
61 |
37 |
2 |
|
2002 Mar 4-7 |
61 |
37 |
2 |
|
2002 Feb 4-6 |
61 |
37 |
2 |
|
2002 Jan 7-9 |
65 |
32 |
3 |
|
|
|
|
|
|
2001 |
|
|
|
|
2001 Dec 6-9 |
70 |
28 |
2 |
|
2001 Nov 8-11 |
65 |
33 |
2 |
|
2001 Oct 11-14 |
67 |
29 |
4 |
|
2001 Sep 14-15 |
61 |
36 |
3 |
|
2001 Sep 7-10 |
43 |
55 |
2 |
|
2001 Aug 16-19 |
48 |
49 |
3 |
|
2001 Jul 19-22 |
51 |
46 |
3 |
|
2001 Jun 11-17 |
51 |
46 |
3 |
|
2001 May 10-14 |
46 |
50 |
4 |
|
2001 Apr 6-8 |
50 |
47 |
3 |
|
2001 Mar 5-7 |
53 |
44 |
3 |
|
2001 Feb 1-4 |
51 |
45 |
4 |
|
2001 Jan 10-14 |
56 |
41 |
3 |
|
|
|
|
|
|
2000 |
|
|
|
|
2000 Dec 2-4 |
51 |
46 |
3 |
|
2000 Nov 13-15 |
58 |
41 |
1 |
|
2000 Oct 6-9 |
62 |
36 |
2 |
|
2000 Aug 29-Sep 5 |
59 |
38 |
3 |
|
2000 Aug 18-19 |
63 |
33 |
4 |
|
2000 Jul 14-16 |
61 |
35 |
4 |
|
2000 Jun 22-25 |
56 |
39 |
5 |
|
2000 May 18-21 |
55 |
42 |
3 |
|
2000 Apr 3-9 |
59 |
37 |
4 |
|
2000 Feb 25-27 |
65 |
32 |
3 |
|
2000 Jan 7-10 |
69 |
28 |
3 |
In general, are you satisfied or dissatisfied with the way things are going in the United States at this time?
|
Satisfied |
Dis- |
No |
|
|
% |
% |
% |
|
|
1999 |
|
|
|
|
1999 Sep 23-26 |
52 |
45 |
3 |
|
1999 Aug 24-26 |
62 |
35 |
3 |
|
1999 Jun 11-13 |
55 |
42 |
3 |
|
1999 May 23-24 |
51 |
46 |
3 |
|
1999 Apr 26-27 |
51 |
45 |
4 |
|
1999 Apr 13-14 |
58 |
39 |
3 |
|
1999 Feb 12-13 |
71 |
26 |
3 |
|
1999 Jan 15-17 |
70 |
28 |
2 |
|
|
|
|
|
|
1998 |
|
|
|
|
1998 Dec 28-29 |
50 |
48 |
2 |
|
1998 Oct 29-Nov 1 |
60 |
34 |
6 |
|
1998 Aug 21-23 |
63 |
34 |
3 |
|
1998 Aug 10-12 |
60 |
36 |
4 |
|
1998 May 8-10 |
59 |
36 |
5 |
|
1998 Apr 17-19 |
58 |
38 |
4 |
|
1998 Feb 20-22 |
64 |
32 |
4 |
|
1998 Feb 13-15 |
59 |
37 |
4 |
|
1998 Jan 30-Feb 1 |
63 |
35 |
2 |
|
|
|
|
|
|
1997 |
|
|
|
|
1997 Dec 18-21 |
50 |
46 |
4 |
|
1997 Aug 22-25 |
50 |
48 |
2 |
|
1997 May 6-7 |
46 |
51 |
3 |
|
1997 Jan 10-13 |
50 |
47 |
3 |
|
|
|
|
|
|
1996 |
|
|
|
|
1996 Dec 9-11 |
43 |
55 |
2 |
|
1996 Nov 21-24 |
47 |
47 |
6 |
|
1996 Oct 26-29 |
39 |
56 |
5 |
|
1996 Aug 30-Sep 1 |
45 |
50 |
5 |
|
1996 Aug 16-18 |
38 |
57 |
5 |
|
1996 May 9-12 |
37 |
60 |
3 |
|
1996 Mar 15-17 |
36 |
61 |
3 |
|
1996 Mar 8-10 |
41 |
56 |
3 |
|
1996 Jan 5-7 |
24 |
72 |
4 |
|
|
|
|
|
|
1995 |
|
|
|
|
1995 Aug 11-14 |
33 |
64 |
3 |
|
1995 Jul 7-9 |
32 |
65 |
3 |
|
1995 Mar 27-29 |
30 |
66 |
4 |
|
|
|
|
|
|
1994 |
|
|
|
|
1994 Nov 28-29 |
29 |
67 |
4 |
|
1994 Nov 2-6 |
30 |
66 |
4 |
|
1994 Oct 22-25 |
31 |
66 |
3 |
|
1994 Jul 15-17 |
33 |
65 |
2 |
|
1994 May 20-22 |
33 |
64 |
3 |
|
1994 Apr 22-24 |
32 |
65 |
3 |
|
1994 Mar 25-27 |
35 |
62 |
3 |
|
1994 Feb 26-28 |
36 |
61 |
3 |
|
1994 Jan 15-17 |
35 |
62 |
3 |
|
|
|
|
|
|
1993 |
|
|
|
|
1993 Dec 4-6 |
34 |
63 |
3 |
|
1993 Nov 2-4 |
27 |
70 |
3 |
|
1993 May 21-23 |
24 |
73 |
3 |
|
1993 Feb 12-14 |
25 |
71 |
4 |
|
1993 Jan 8-11 |
29 |
68 |
3 |
|
|
|
|
|
|
1992 |
|
|
|
|
1992 Nov 11-12 |
26 |
68 |
6 |
|
1992 Aug 28-Sep 2 ‡ |
22 |
73 |
5 |
|
1992 Jul 31-Aug 2 |
17 |
80 |
3 |
|
1992 Jun 12-14 |
14 |
84 |
2 |
|
1992 May 7-10 |
20 |
77 |
3 |
|
1992 Apr 20-22 ^ |
19 |
80 |
1 |
|
1992 Mar 20-22 |
19 |
80 |
1 |
|
1992 Feb 28-Mar 1 |
21 |
78 |
1 |
|
1992 Jan 31-Feb 2 ^ |
24 |
75 |
1 |
|
1992 Jan 3-6 ^ |
24 |
74 |
2 |
|
|
|
|
|
|
1991 |
|
|
|
|
1991 Dec 5-8 |
37 |
60 |
3 |
|
1991 Oct 31-Nov 2 |
35 |
62 |
3 |
|
1991 Oct 10-13 |
39 |
57 |
4 |
|
1991 Aug 23-25 |
49 |
45 |
6 |
|
1991 Jul 11-14 |
43 |
50 |
7 |
|
1991 May 23-26 |
49 |
49 |
2 |
|
1991 Mar 21-24 |
52 |
43 |
5 |
|
1991 Feb 28-Mar 3 |
66 |
31 |
3 |
|
1991 Feb 14-17 |
54 |
40 |
6 |
|
1991 Jan 17-21 |
62 |
33 |
5 |
|
1991 Jan 3-6 |
32 |
61 |
7 |
|
|
|
|
|
|
1990 |
|
|
|
|
1990 Dec 13-16 |
33 |
64 |
3 |
|
1990 Nov 1-4 |
32 |
64 |
4 |
|
1990 Oct 25-28 |
31 |
66 |
3 |
|
1990 Oct 11-14 |
29 |
67 |
4 |
|
1990 Sep 27-30 |
37 |
58 |
5 |
|
1990 Aug 30-Sep 2 |
51 |
44 |
5 |
|
1990 Aug 9-12 |
43 |
51 |
6 |
|
1990 Jul 19-22 |
45 |
51 |
4 |
|
1990 Feb 8-11 |
55 |
39 |
6 |
|
^ Registered voters |
|||
In general, are you satisfied or dissatisfied with the way things are going in the United States at this time?
|
Satisfied |
Dis- |
No |
|
|
% |
% |
% |
|
|
1989 |
|
|
|
|
1989 May 4-7 |
44 |
50 |
6 |
|
1989 Feb |
45 |
50 |
5 |
|
|
|
|
|
|
1988 |
|
|
|
|
1988 Sep 25-Oct 1 |
56 |
40 |
4 |
|
1988 May 13-15 |
41 |
54 |
5 |
|
|
|
|
|
|
1987 |
|
|
|
|
1987 Aug 24-Sep 2 |
45 |
49 |
6 |
|
|
|
|
|
|
1986 |
|
|
|
|
1986 Dec 4-5 † |
47 |
49 |
4 |
|
1986 Sep 3-17 |
58 |
38 |
4 |
|
1986 Jun 9-16 |
69 |
26 |
5 |
|
1986 Mar 7-10 |
66 |
30 |
4 |
|
|
|
|
|
|
1985 |
|
|
|
|
1985 Nov 11-18 |
51 |
46 |
3 |
|
|
|
|
|
|
1984 |
|
|
|
|
1984 Dec |
52 |
40 |
8 |
|
1984 Sep 28-Oct 1 |
48 |
45 |
7 |
|
1984 Feb 10-13 |
50 |
46 |
4 |
|
|
|
|
|
|
1983 |
|
|
|
|
1983 Aug 5-8 |
35 |
59 |
6 |
|
|
|
|
|
|
1982 |
|
|
|
|
1982 Nov 5-8 |
24 |
72 |
4 |
|
1982 Sep 17-20 |
24 |
72 |
4 |
|
1982 Apr 2-5 |
25 |
71 |
4 |
|
|
|
|
|
|
1981 |
|
|
|
|
1981 Dec 11-14 |
27 |
67 |
6 |
|
1981 Jun 5-8 |
33 |
61 |
6 |
|
1981 Jan 9-12 |
17 |
78 |
5 |
|
|
|
|
|
|
1979 |
|
|
|
|
1979 Nov 2-5 |
19 |
77 |
4 |
|
1979 Jul 13-16 |
12 |
84 |
4 |
|
1979 Feb 2-5 |
26 |
69 |
5 |
|
† Gallup/Newsweek |
|||