GALLUP NEWS SERVICE
PRINCETON, NJ -- Recent Gallup polling has shown Americans giving more positive reviews of the national economy. A recent Gallup Poll panel survey probed further into the public's perceptions of the economy by asking people to rate a variety of different economic factors beyond the national economy. The poll finds Americans are most positive about the current state of the stock market, local economic conditions, and their own financial situations. However, a statistical analysis shows that the job market is the most important factor in predicting Americans' overall views of the national economy.
Economic Ratings
In the most recent update on public ratings of the national economy, from a Jan. 15-18, 2007 Gallup Poll, 52% of Americans describe the economy as "excellent" or "good," while 33% say it is "only fair" and only 15% say it is "poor." These ratings of the economy are the most positive Gallup has measured since the beginning of 2001. For example, an average of just 38% of Americans rated the economy as excellent or good throughout 2006, with the high for the year at 44% in October.
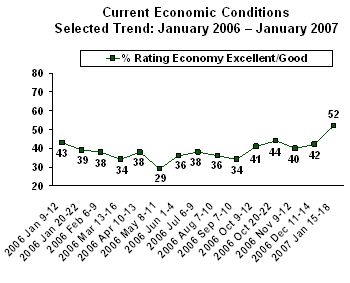
To gain further insight into why Americans view the economy more positively, a Jan. 25-28, 2007 Gallup Panel survey asked a nationally representative sample of Americans to rate 16 different aspects of the economy spanning their own finances, local economic conditions, and a variety of specific national economic conditions. Respondents rated each item -- as well as the national economy -- as currently being very good, good, just fair, or poor. In this poll, 48% rated the national economy as very good or good.
Of all the specific economic factors, Americans are most positive about the stock market, their own financial situations, and local economic conditions -- at least half of Americans describe these as being very good or good right now. On the other hand, Americans give the highest negative ratings to the federal budget deficit, healthcare costs, and the gap between the rich and poor in the country, with a majority rating each of these as poor.
|
Americans' Ratings of Different Aspects of the Economy, Jan. 25-28, 2007 |
|||
|
Very good/Good |
Just fair |
Poor |
|
|
% |
% |
% |
|
|
The U.S. stock market |
58 |
26 |
6 |
|
Your personal financial situation |
56 |
29 |
15 |
|
Economic conditions in your local community |
50 |
31 |
18 |
|
Economic conditions in your state |
45 |
36 |
19 |
|
The job market in the United States |
43 |
34 |
22 |
|
The housing market in the United States |
38 |
40 |
20 |
|
Inflation |
35 |
40 |
22 |
|
Wages for American workers |
32 |
33 |
35 |
|
The amount people pay in state and local taxes where you live |
30 |
43 |
26 |
|
The amount Americans pay in federal taxes |
24 |
44 |
31 |
|
The Social Security system |
21 |
34 |
43 |
|
Gas prices |
20 |
35 |
44 |
|
The gap between the rich and poor in the United States |
13 |
24 |
62 |
|
College tuition and expenses |
11 |
36 |
49 |
|
Healthcare costs |
9 |
26 |
65 |
|
The federal budget deficit |
7 |
23 |
67 |
In addition to the stock market, personal finances, and local economic conditions, Americans are also more positive than negative about state economic conditions (45% very good/good vs. 19% poor), the job market (43% vs. 22%), the housing market (38% vs. 20%), and inflation (35% vs. 22%).
Americans are about equally likely to rate wages for American workers (32% vs. 35%) and the amount people pay in state and local taxes (30% vs. 26%) as good or poor.
On seven items, the public is more likely to give a poor rating than a good rating. These include: the amount people pay in federal taxes (24% very good/good vs. 31% poor); the Social Security system (21% vs. 43%); gas prices (20% vs. 44%); college tuition and expenses (11% vs. 49%); the gap between the rich and poor in this country (13% vs. 62%); healthcare costs (9% vs. 65%); and the federal budget deficit (7% vs. 67%).
Which Factors Are Most Influential?
The ratings give a sense of how Americans view a wide range of economic conditions, but by themselves cannot say which factors are most influential in determining Americans' overall ratings of the economy. A statistical analysis that attempts to explain variations in overall ratings of the economy on the basis of ratings of these specific aspects can provide insight into what is behind the public's views of the economy. And it can give a sense of why Americans are increasingly upbeat about the economy.
The analysis finds ratings of the job market are most predictive in terms of how Americans view the overall national economy. Ratings of economic inequality -- the gap between the rich and poor -- are the next most influential. Other factors that show a statistically meaningful relationship to views of the national economy include ratings of wages for American workers, the local economy, the stock market, gas prices, the housing market, and federal taxes. Party identification is also related to ratings of the national economy, with Republicans rating it better than independents, who in turn rate it more positively than Democrats.
On the other hand, Americans' ratings of their own personal financial situations, as well as their household income levels, have little impact on how they view national economic conditions overall. Ratings of healthcare costs, college expenses, and Social Security also tend to be inconsequential when Americans assess the state of the national economy.
The following table shows the specific results of the analysis. The various economic factors are rank-ordered from the most influential to the least influential in predicting Americans' overall rating of the national economy. The total effect gives a sense of the magnitude of each factor. Specifically, it shows the differences in ratings of the national economy on the four-point very good to poor scale between a person rating each factor most positively (e.g., very good) and a person rating each factor most negatively (e.g., poor), once the influence of the other factors are taken into account. Thus, a person rating the job market as very good can be expected to give the national economy a rating nearly one point higher than a person rating the job market as poor, regardless of their ratings on any of the other items.
|
Results of Regression Predicting Views of Overall National Economy Based on Views of Specific Economic Factors |
||
|
Variable |
Regression coefficient |
Total effect |
|
Factors that are predictive of national economic ratings |
||
|
Job market |
.25 |
.75 |
|
Gap between rich/poor |
.20 |
.60 |
|
Wages |
.13 |
.39 |
|
Local economic conditions |
.12 |
.36 |
|
Stock market |
.11 |
.33 |
|
Gas prices |
.09 |
.27 |
|
Housing market |
.08 |
.24 |
|
Federal taxes |
-.08 |
-.24 |
|
Party identification |
-.08 |
-.16 |
|
Factors that are not predictive of national economic ratings |
||
|
Federal budget deficit |
.09 |
.27 |
|
Personal financial situation |
.05 |
.15 |
|
Household income level |
-.03 |
-.12 |
|
State economic conditions |
.03 |
.09 |
|
Inflation |
.02 |
.06 |
|
Social Security |
.02 |
.06 |
|
State/local taxes |
.02 |
.06 |
|
Healthcare costs |
-.02 |
-.06 |
|
College costs |
-.02 |
-.06 |
What the analysis shows is the bread-and-butter economic issues such as jobs and wages have a major effect on how Americans' view the national economy. Indeed, Gallup's monthly tracking of Americans' ratings of the job market have picked up in the last two months along with overall national economic ratings, suggesting that more favorable evaluations of the job climate are a major reason why Americans are growing more upbeat about the economy overall.
Also, the model shows local economic conditions are quite influential in determining how the public views the national economy, as Americans' direct observations of economic conditions around them are likely projected to the country overall. The stock market, gas prices, and housing prices, which affect Americans' disposable income and perceptions of their wealth, are also important factors in national economic ratings. Factors that only affect a smaller segment of the public -- Social Security, college costs, and arguably, healthcare costs -- play a small role in determining how Americans view the national economy.
Survey Methods
Results for this panel study are based on telephone interviews with 1,008 national adults, aged 18 and older, conducted Jan. 25-28, 2007. Respondents were randomly drawn from Gallup's nationally representative household panel, which was originally recruited through random selection methods. For results based on the total sample of national adults, one can say with 95% confidence that the maximum margin of sampling error is ±4 percentage points. In addition to sampling error, question wording and practical difficulties in conducting surveys can introduce error or bias into the findings of public opinion polls.
6. How would you rate economic conditions in this country today -- as very good, good, just fair, or poor?
|
Very good |
Good |
Just fair |
Poor |
No opinion |
|
|
2007 Jan 25-28 |
14% |
34 |
38 |
13 |
* |
|
* = Less than 0.5% |
|||||
7. Next, I'm going to ask about several aspects of the economy today, and I'd like you to rate each one. First, how would you rate [ITEMS A-L ROTATED FIRST, THEN ITEMS M-O ROTATED, ITEM P READ LAST] today, as very good, good, just fair, or poor?
A. The job market in the United States
|
Very good |
Good |
Just fair |
Poor |
No opinion |
|
|
2007 Jan 25-28 |
7% |
36 |
34 |
22 |
1 |
B. The housing market in the United States
|
Very good |
Good |
Just fair |
Poor |
No opinion |
|
|
2007 Jan 25-28 |
6% |
32 |
40 |
20 |
2 |
C. The U.S. stock market
|
Very good |
Good |
Just fair |
Poor |
No opinion |
|
|
2007 Jan 25-28 |
12% |
46 |
26 |
6 |
11 |
D. Inflation
|
Very good |
Good |
Just fair |
Poor |
No opinion |
|
|
2007 Jan 25-28 |
6% |
29 |
40 |
22 |
2 |
E. Gas prices
|
Very good |
Good |
Just fair |
Poor |
No opinion |
|
|
2007 Jan 25-28 |
3% |
17 |
35 |
44 |
1 |
F. The federal budget deficit
|
Very good |
Good |
Just fair |
Poor |
No opinion |
|
|
2007 Jan 25-28 |
1% |
6 |
23 |
67 |
3 |
G. The amount Americans pay in federal taxes
|
Very good |
Good |
Just fair |
Poor |
No opinion |
|
|
2007 Jan 25-28 |
2% |
22 |
44 |
31 |
2 |
H. Healthcare costs
|
Very good |
Good |
Just fair |
Poor |
No opinion |
|
|
2007 Jan 25-28 |
2% |
7 |
26 |
65 |
1 |
I. Wages for American workers
|
Very good |
Good |
Just fair |
Poor |
No opinion |
|
|
2007 Jan 25-28 |
5% |
27 |
33 |
35 |
1 |
J. The gap between the rich and poor in the United States
|
Very good |
Good |
Just fair |
Poor |
No opinion |
|
|
2007 Jan 25-28 |
2% |
11 |
24 |
62 |
2 |
K. The Social Security system
|
Very good |
Good |
Just fair |
Poor |
No opinion |
|
|
2007 Jan 25-28 |
2% |
19 |
34 |
43 |
2 |
L. College tuition and expenses
|
Very good |
Good |
Just fair |
Poor |
No opinion |
|
|
2007 Jan 25-28 |
1% |
10 |
36 |
49 |
4 |
M. Economic conditions in your local community
|
Very good |
Good |
Just fair |
Poor |
No opinion |
|
|
2007 Jan 25-28 |
10% |
40 |
31 |
18 |
* |
|
* = Less than 0.5% |
|||||
N. Economic conditions in your state
|
Very good |
Good |
Just fair |
Poor |
No opinion |
|
|
2007 Jan 25-28 |
7% |
38 |
36 |
19 |
1 |
O. The amount people pay in state and local taxes where you live
|
Very good |
Good |
Just fair |
Poor |
No opinion |
|
|
2007 Jan 25-28 |
4% |
26 |
43 |
26 |
1 |
P. Your personal financial situation
|
Very good |
Good |
Just fair |
Poor |
No opinion |
|
|
2007 Jan 25-28 |
11% |
45 |
29 |
15 |
1 |