GALLUP NEWS SERVICE
PRINCETON, NJ -- A recent Gallup poll of e-mail users finds that more than nine in 10 say that both e-mail (97%) and the Internet (96%) have made their lives better. The typical e-mail user is on the Internet seven to eight hours each week, and 37% indicate they use it more than 10 hours per week. Sending and reading e-mail is the most common activity for people when online, much more so than searching for information, paying bills or using Instant Messages (IMs). Nine in 10 say they use e-mail at home, and more than eight in 10 say they use it at work. While a majority of e-mail users say they use the telephone and U.S. mail less often now, most are not willing to sacrifice these older methods of communication just yet.
E-mail is Most Common Online Activity
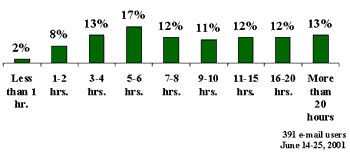
The poll, conducted via the Internet June 14-25, 2001, included respondents who had e-mail addresses and were part of random samples of national adults in earlier Gallup telephone polls. The results show a wide range in the amount of time e-mail users spend online. Many spend fewer than five hours per week on the Internet, but about one in eight spends 20 hours or more online. A typical e-mail user spends 7-8 hours online (half spend more time online and half spend less). There are very few differences in the amount of time spent on the Internet by gender or age, though the heaviest users of the Internet -- those online 40 hours or more per week -- are usually male or below the age of 50.
| On average, how many hours per week do you use the Internet? |
 |
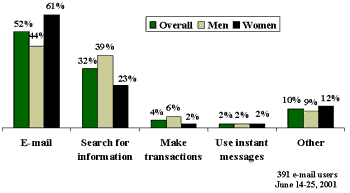
A majority, 52%, of e-mail users says that sending and receiving e-mail is their most common online activity. Thirty-two percent spend most of their time online searching the Internet for information on topics that interest them. Very few make financial transactions, such as buying products, paying bills and checking financial accounts (4%), or send and receive Instant Messages (2%) more often than they send e-mail or search for information.
Men and women differ somewhat in their online activity. Among women, a majority (61%) says that sending and receiving e-mail messages is the activity they do most when online. Far fewer men, 44%, say e-mail is the most common online activity for them. Searching the Internet for information on topics of interest to them is nearly as common as e-mail for men (39%). Only 23% of women say searching for information is their most frequent online activity.
| Which of the following activities do you do most when you are online? |
 |
Media reports indicate that teenagers spend a great deal of their Internet time using Instant Messages, which are real-time messages sent to other people online. The survey suggests that use of IMs among adults is quite rare. A majority of respondents, 58%, say they never use IMs when online. About one in three use IMs occasionally, 8% do so frequently, and only 3% use IMs every time they are online.
More E-mail Activity at Work Than at Home
Ninety percent of e-mail users say they use e-mail at home, and 83% use it at work. Fifty-three percent use e-mail at both places, and not surprisingly, most have more than one e-mail address (23% have only one). In fact, 33% have two unique e-mail addresses, 14% have three, 7% have four, and 22% have five or more.
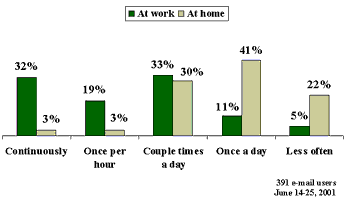
E-mail use differs between home and work. Those who use it at work check it much more often, and send and receive many more e-mails. A majority, 51%, of those who use e-mail at work check it at least once an hour, including 32% who say they check it "continuously." An additional 33% say they check e-mail at work a couple times a day, and 11% check it about once a day. Only 5% check it less often than once a day. At home, only 6% say they check e-mail at least once an hour, including just 3% who check it continuously. Most people check their e-mail at home either a couple times a day (30%) or about once a day (41%), but 22% check it less often.
| How often do you check your e-mail? |
 |
The typical e-mail user receives 12 e-mails at work each day, and 28% receive 20 or more e-mails at work each day. Sending e-mail is less common, as the typical user sends just six e-mails at work each day, and just 16% send 20 or more messages per day.
At home, a typical e-mail user will receive just eight messages each day and send only three. Only 11% say they receive more than twenty e-mail messages each day at home, and only 1% send that many from home.
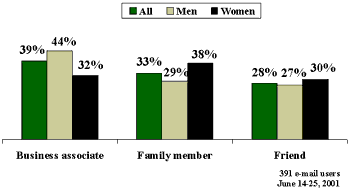
Because e-mails are sent and received more frequently at work, it is not surprising that respondents cite coworkers and business associates as the people they e-mail most often (39% say this). Thirty-three percent e-mail family members most often, including children (9%), brothers or sisters (9%), spouses or significant others (6%), mothers or fathers (5%), and other relatives such as grandparents, aunts, uncles and cousins (4%). Twenty-eight percent indicate that they e-mail friends most often.
Men are more likely than women to say they most often e-mail business associates, by a 44% to 32% margin. Women are more likely to e-mail family members (38% across all categories) than business associates (32%) and friends (30%). Men are about equally likely to e-mail family members (29%) and friends (27%).
| Who would you say is the one person you e-mail most often, either at home or at work? |
 |
Most E-Mail Users Not Ready to Give Up Telephone
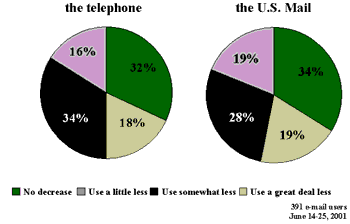
E-mail has given people another way to communicate with friends, family and coworkers, one that is generally cheaper or faster than more established means of communication. A majority of e-mail users say they now use the telephone and U.S. mail less often, and about one in five indicate they use the telephone and U.S. mail "a great deal less." Just one in three e-mail users say that e-mail has NOT decreased their use of the telephone or the U.S. mail.
| How has e-mail affected your use of … |
 |
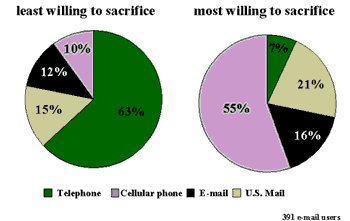
Despite the fact that e-mail messages are frequently used as alternatives to telephone calls or postal mail, most e-mail users do not see it as indispensable. When asked which of four communication modes they would be least willing to sacrifice, e-mail users say they are least willing to do without the telephone (63%). U.S. mail trails at 15%, followed by e-mail (12%) and cellular phones (10%).
Women (69%) are more likely than men (58%) to say they would not be willing to sacrifice the telephone. Men are less willing to give up e-mail -- 15% of men, compared to 8% of women, would not do without e-mail. The genders show little difference in their willingness to part with postal mail or cellular phones.
Age differences are also apparent – 21% of those between the ages of 18 and 29 would be least willing to sacrifice e-mail, many more than those aged 30-49 (12%) and 50 and older (7%). Conversely, older respondents are least willing to sacrifice the telephone -- 70% of those aged 50 and older would not want to give up the telephone, compared to 61% of those 30-49 and 53% of those 18-29.
Even though most would keep their telephone if they had to choose, e-mail users are in no rush to get rid of their e-mail. Of these four methods of communication, e-mail users are most willing to sacrifice cellular phones (55%) followed by U.S. mail (21%), e-mail (16%) and the telephone (7%).
| From the list below, please indicate the method of communication you would be … |
 |
There are essentially no differences between men and women on this question, though age differences do exist. Those aged 50 and older are more willing to part with cellular phones (62%) than are those below the age of 50 (50%). Older respondents (21%) would be somewhat more willing to sacrifice their e-mail than are respondents below the age of 50 (14%). In contrast, those above the age of 50 are much less likely to want to give up the U.S. mail (12%) than are those under age 50 (26%).
E-mail Users Find "Spam" Annoying, But Internet Pop-Up Ads Worse
The widespread use of e-mail has led to the rise of "spam," or unsolicited bulk e-mail that promotes products or services. Most e-mail users say that up to three out of every 10 e-mail messages they receive are spam, and 39% say they receive more than that, including 18% who say that at least half their e-mail is spam.
When asked their opinion on spam, 42% of e-mail users say they "hate it," 45% say they find it "an annoyance, but do not hate it," while the rest have no strong feelings either way (9%), or sometimes find the information contained in spam useful (4%). Younger e-mail users, those between the ages of 18-29, are much more likely to say they hate spam (67%) than are those between the ages of 30-49 (43%) and those 50 and older (26%). Men are a little more likely than women to say they hate spam, 45% to 38%.
While spam is a bother to most e-mail users, Internet pop-up ads are apparently worse. Asked which they find more annoying, by a 65% to 34% margin, e-mail users choose pop-up ads. All subcategories of e-mail users show roughly equal disdain for Internet pop-up ads.
Survey Methods
Results are based on online interviews with 391 national adults with e-mail addresses, aged 18+, originally contacted in a telephone survey, who agreed to be re-contacted for a future survey by e-mail, conducted June 14-25, 2001. For results based on this sample, one can say with 95 percent confidence that the maximum error attributable to sampling and other random effects is plus or minus 3 percentage points. In addition to sampling error, question wording and practical difficulties in conducting surveys can introduce error or bias into the findings of public opinion polls.
On average, how many hoursper weekdo you use the Internet?
|
2001 Jun 14-25 |
|
|
% |
|
|
Less than 1 hour |
2 |
|
1-2 hours |
8 |
|
3-4 hours |
13 |
|
5-6 hours |
17 |
|
7-8 hours |
12 |
|
9-10 hours |
11 |
|
11-15 hours |
12 |
|
16-20 hours |
12 |
|
21-30 hours |
5 |
|
31-40 hours |
3 |
|
40 hours or more |
5 |
|
No answer |
0 |
Which of the following activities do you do most when you are online?
|
2001 Jun 14-25 |
|
|
% |
|
|
Send and read e-mail |
52 |
|
Send and read Instant Messages |
2 |
|
Search the Internet for information on topics that interest you |
32 |
|
Make transactions such as buying products, paying bills or checking financial accounts |
4 |
|
Other |
10 |
|
No answer |
0 |
Would you say the Internet has generally made your life better or worse?
|
Better |
Worse |
No answer |
|
|
2001 Jun 14-25 |
96% |
2 |
2 |
Thinking about e-mail,
Do you use e-mail at home?
|
Yes |
No |
No answer |
|
|
2001 Jun 14-25 |
90% |
10 |
* |
Do you use e-mail at work?
BASED ON -- 293 -- FULL OR PART-TIME EMPLOYED ADULTS; ±6 PCT. PTS.
|
Yes |
No |
No answer |
|
|
2001 Jun 14-25 |
83% |
16 |
1 |
How many separate e-mail addresses do you personally have for sending and receiving e-mail messages, including those for personal and business use?
|
2001 Jun 14-25 |
|
|
% |
|
|
One |
23 |
|
Two |
33 |
|
Three |
14 |
|
Four |
7 |
|
Five or more |
22 |
|
No answer |
1 |
|
Mean |
7.5 |
|
Median |
2 |
Would you say e-mail has generally made your life better or worse?
|
Better |
Worse |
No answer |
|
|
2001 Jun 14-25 |
97% |
2 |
1 |
What percentage of the e-mail you receive each week is "spam," or unsolicited bulk e-mail that promotes a product or service?
|
2001 Jun 14-25 |
|
|
% |
|
|
10% or less |
30 |
|
11-20% |
16 |
|
21-30% |
15 |
|
31-40% |
11 |
|
41-50% |
10 |
|
51-60% |
6 |
|
61-70% |
4 |
|
71-80% |
5 |
|
81-90% |
2 |
|
91-100% |
1 |
|
No answer |
* |
Would you say you -- hate spam, find spam an annoyance, but do not hate it, have no strong feelings either way about spam, sometimes find the information in spam interesting and useful, or really like to receive spam?
|
2001 Jun 14-25 |
|
|
% |
|
|
Hate spam |
42 |
|
Find spam an annoyance, but do not hate it |
45 |
|
Have no strong feelings either way about spam |
9 |
|
Sometimes find the information in spam interesting and useful |
4 |
|
Really like to receive spam |
0 |
|
No answer |
* |
Which of the following do you find more annoying -- [ROTATED: "spam," or unsolicited e-mail promoting a product or service (or) Internet "pop-up" ads that promote a product or service and appear when you visit certain web pages]?
|
2001 Jun 14-25 |
|
|
Spam |
34% |
|
Internet "pop-up" ads |
65 |
|
No answer |
1 |
How has your use of e-mail affected your use of the telephone?
|
2001 Jun 14-25 |
|
|
% |
|
|
You now use the phone a great deal less |
18 |
|
You now use the phone somewhat less |
34 |
|
You now use the phone a little bit less |
16 |
|
There has been no decrease in your use of the phone |
32 |
|
No answer |
0 |
How has your use of e-mail affected your use of the U.S. mail provided by the Postal Service?
|
2001 Jun 14-25 |
|
|
% |
|
|
You now use U.S. mail a great deal less |
19 |
|
You now use U.S. mail somewhat less |
28 |
|
You now use U.S. mail a little bit less |
19 |
|
There has been no decrease in your use of U.S. mail |
34 |
|
No answer |
0 |
From the list below, please indicate the method of communication you would be least willing to sacrifice if you had to stop using one.
|
2001 Jun 14-25 |
|
|
% |
|
|
Telephone |
63 |
|
|
12 |
|
Mobile or cellular phone |
10 |
|
U.S. mail |
15 |
|
No answer |
0 |
From the list below, please indicate the method of communication you would be most willing to sacrifice if you had to stop using one.
|
2001 Jun 14-25 |
|
|
% |
|
|
Telephone |
7 |
|
|
16 |
|
Mobile or cellular phone |
55 |
|
U.S. mail |
21 |
|
No answer |
1 |
How often do you check your e-mail when you are at work?
BASED ON -- 242 -- ADULTS WHO USE E-MAIL AT WORK; ±7 PCT. PTS.
|
2001 Jun 14-25 |
|
|
All the time, continuously |
32 |
|
At least once per hour |
19 |
|
A couple times a day |
33 |
|
About once a day |
11 |
|
A couple of times a week |
3 |
|
About once a week |
0 |
|
Less than once a week |
2 |
|
No answer |
* |
How many e-mails would you say you receive at work EACH DAY?
BASED ON -- 242 -- ADULTS WHO USE E-MAIL AT WORK; ±7 PCT. PTS.
|
2001 Jun 14-25 |
|
|
% |
|
|
5 or less |
27 |
|
6-10 |
19 |
|
11-15 |
13 |
|
16-20 |
10 |
|
21-30 |
12 |
|
31-40 |
2 |
|
41-50 |
8 |
|
More than 50 |
6 |
|
No answer |
2 |
|
Mean |
23.8 |
|
Median |
12 |
How many e-mails would you say you send at work EACH DAY?
BASED ON -- 242 -- ADULTS WHO USE E-MAIL AT WORK; ±7 PCT. PTS.
|
2001 Jun 14-25 |
|
|
% |
|
|
5 or less |
48 |
|
6-10 |
16 |
|
11-15 |
11 |
|
16-20 |
5 |
|
21-30 |
8 |
|
31-40 |
4 |
|
41-50 |
2 |
|
More than 50 |
2 |
|
No answer |
4 |
|
Mean |
12.8 |
|
Median |
6 |
How often do you check your e-mail when you are at home?
BASED ON -- 351 -- ADULTS WHO USE E-MAIL AT HOME; ±6 PCT. PTS.
|
2001 Jun 14-25 |
|
|
% |
|
|
All the time, continuously |
3 |
|
At least once per hour |
3 |
|
A couple times a day |
30 |
|
About once a day |
41 |
|
A couple of times a week |
16 |
|
About once a week |
5 |
|
Less than once a week |
1 |
|
No answer |
1 |
How many e-mails would you say you receive at home EACH DAY?
BASED ON -- 351 -- ADULTS WHO USE E-MAIL AT HOME; ±6 PCT. PTS.
|
2001 Jun 14-25 |
|
|
% |
|
|
5 or less |
42 |
|
6-10 |
28 |
|
11-15 |
10 |
|
16-20 |
9 |
|
21-30 |
6 |
|
31-40 |
1 |
|
41-50 |
2 |
|
More than 50 |
2 |
|
No answer |
1 |
|
Mean |
11.4 |
|
Median |
8 |
How many e-mails would you say you send at home EACH DAY?
BASED ON -- 351 -- ADULTS WHO USE E-MAIL AT HOME; ±6 PCT. PTS.
|
2001 Jun 14-25 |
|
|
% |
|
|
5 or less |
79 |
|
6-10 |
7 |
|
11-15 |
2 |
|
16-20 |
1 |
|
21-30 |
1 |
|
31-40 |
0 |
|
41-50 |
* |
|
More than 50 |
0 |
|
No answer |
9 |
|
Mean |
4.0 |
|
Median |
3 |
Who would you say is the one person you e-mail most often, either at home or at work?
|
2001 Jun 14-25 |
|
|
% |
|
|
Spouse or significant other |
6 |
|
Brother or sister |
9 |
|
Mother or father |
5 |
|
Your own child |
9 |
|
Another relative such as an aunt, uncle, grandparent, or cousin |
4 |
|
Friend |
28 |
|
Coworker, business associate, professional associate, client |
39 |
|
No answer |
0 |
Which of the following best describes your use of Instant Messages, or IMs?
|
2001 Jun 14-25 |
|
|
% |
|
|
I use IMs every time I am online |
3 |
|
I use IMs frequently, but not every time I am online |
8 |
|
I use IMs occasionally when I am online |
31 |
|
I never use IMs when I am online |
58 |
|
No answer |
* |
*Less than 0.5%

