GALLUP NEWS SERVICE
PRINCETON, NJ -- Consumer spending has been keeping the economy afloat this year, and although women are often typecast as "shopaholics," men may deserve just as much credit for keeping the nation's cash registers ringing. According to a Gallup poll conducted this past April, men are as likely as women to say they enjoy spending money and to report shopping frequently at department stores and malls, online and at other venues.
Americans can be divided fairly evenly into two camps, according to their relationship with money: 45% describe themselves as people who more enjoy spending money; 48% say they more enjoy saving money. Men and women are virtually identical in their answers to this (44% of men and 45% of women say they prefer spending money to saving it).
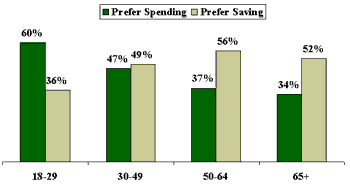
In contrast to gender differences, there are large differences in attitudes about money among Americans of different ages, with the preference for spending money topping out at 60% among young adults, and dropping steadily through the generations to a low of 34% among those 65 years and older.
| Spending/Saving Preference by Age |
 |
| April 6-8, 2001 |
Catalogs Lead Internet and TV Home Shopping in Frequency of Use
Gallup's April 6-8 national telephone survey found that going to malls, department stores or other shopping areas (excluding grocery shopping) is a nearly universal experience for Americans. Ninety-six percent of U.S. adults report that they do this at one time or another: 21% shop weekly at stores, 34% several times a month, 34% a few times a year, 6% about once a year and 1% do so less than once a year. Only 4% of Americans say they "never" shop at stores.
Shopping by catalog ranks second to store shopping among Americans, with roughly six in 10 adults (61%) saying they use catalogs at least sometimes. By comparison, only 40% ever shop on the Internet and just 17% ever shop through TV home shopping channels.
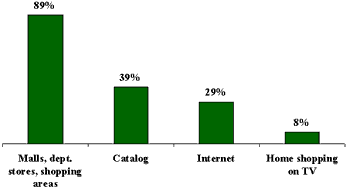
While most Americans tend to shop in stores on a weekly or monthly basis, few who use catalogs, the Internet or TV home shopping do so more than a few times a year. The total percentage who shop at least a few times a year in each of the four ways measured is shown below:
| Percentage Shopping at Least a Few Times a Year at Each Venue |
 |
| April 6-8, 2001 |
The following table details these numbers among men and women. The survey found little difference between the genders in their rates of shopping at stores, on the Internet, or through home shopping channels. More women than men appear to use catalogs, however.
|
Percentage Shopping at Least a Few Times a Year, by Gender April 6-8, 2001 |
||
|
Men |
Women |
|
|
% |
% |
|
|
Malls, department stores, shopping areas |
89 |
89 |
|
Catalog |
33 |
44 |
|
Internet |
30 |
28 |
|
Home shopping on TV |
7 |
9 |
Those Who Have, Save; Those Who Don't, Spend?
One interesting finding of the survey is that Americans with incomes of at least $75,000 per year are no more likely to report frequent shopping than do those with much less income. About a quarter (24%) of all Americans indicate that, excluding grocery shopping, they shop at least weekly in one venue or another. Another third (37%) shop at least several times a month and an additional third (38%) shop less frequently than that. These results are similar for each of several major income groups.
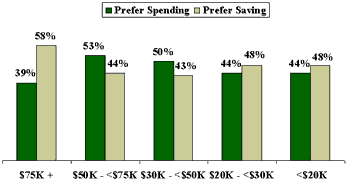
It could be that people with higher incomes have more opportunities to save, and thus have a better appreciation for the experience. In any case, high-income earners are the only income group in which a clear majority says it prefers saving money to spending it. Middle-income Americans (those earning between $30,000 and $74,999 per year) tend to say they prefer spending money, while lower-income groups are evenly divided.
| Spending/Saving Preference by Income |
 |
| April 6-8, 2001 |
Survey Methods
These results are based on telephone interviews with a randomly selected national sample of 1,025 adults, 18 years and older, conducted April 6-8, 2001. For results based on this sample, one can say with 95 percent confidence that the maximum error attributable to sampling and other random effects is plus or minus 3 percentage points. In addition to sampling error, question wording and practical difficulties in conducting surveys can introduce error or bias into the findings of public opinion polls.
Thinking about money for a moment, are you the type of person who -- [ROTATED: more enjoys spending money (or who) more enjoys saving money]?
|
Spending money |
Saving money |
No opinion |
|
|
2001 Apr 6-8 |
45% |
48 |
7 |
Not counting grocery shopping, how often, if ever, do you shop in each of the following ways -- at least once a week, several times a month, a few times a year, about once a year, less often than that, or never? How about… [RANDOM ORDER]?
A. Going to malls, department stores or other shopping areas
|
|
Several times a month |
Few times |
About once |
|
|
|
|
|
2001 Apr 6-8 |
21% |
34 |
34 |
6 |
1 |
4 |
* |
B. Online using the Internet
|
|
Several times a month |
Few times |
About once |
|
|
|
|
|
2001 Apr 6-8 |
3% |
9 |
17 |
7 |
3 |
60 |
1 |
C. By telephone when watching home shopping channels on TV
|
|
Several times a month |
Few times |
About once |
|
|
|
|
|
2001 Apr 6-8 |
1% |
1 |
6 |
4 |
5 |
83 |
* |
D. By catalog
|
|
Several times a month |
Few times |
About once |
|
|
|
|
|
2001 Apr 6-8 |
1% |
7 |
31 |
15 |
7 |
39 |
* |
* Less than 0.5%

