GALLUP NEWS SERVICE
PRINCETON, NJ -- A slow economy has experts predicting a smaller than anticipated budget surplus. As a result, some critics have argued that the recently enacted tax cut will force the government to use the Social Security trust fund to pay for many government programs. Some have suggested that the tax cut be repealed or scaled back. President Bush defends it by saying that, despite the tax cut and the slow economy, this year's budget will still result in the second-largest surplus in history.
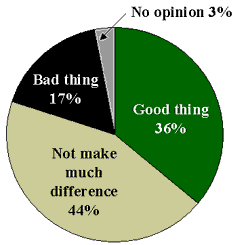
A new Gallup poll conducted August 16-19 shows that the public does not have major concerns about the tax cut. Only about one in six think it will be a bad thing for the country, and a similarly small percentage think that, in retrospect, the tax cut should have been smaller than it was. In fact, the percentage of Americans who think it will be a good thing for the country (36%) is about double the percentage who think it will be a bad thing (17%). A plurality of Americans, 44%, believes the tax cut will not make much difference. There has been little change in opinion since a July 19-22 poll, at which time 40% said the tax cut would be a good thing for the country, 18% a bad thing, and 39% said it would not make much difference.
| Do you think that the new tax cut law will be a good thing for the country, will not make much difference, or will be a bad thing for the country? |
 |
| August 16-19, 2001 |
Nearly every key subgroup holds a more positive than negative view of the tax cuts. The most notable exception is among self-described liberals who think, by a 32% to 23% margin, the tax cut will be bad for the country. By contrast, conservatives (by a 57% to 7% margin) are substantially more likely to think the tax cut will benefit the nation. Opposition to the tax cut is even muted among Democrats -- only 23% say the cut will be bad for the country while a similar percentage, 26%, say it will be good.
Public Believes Size of Tax Cut was About Right
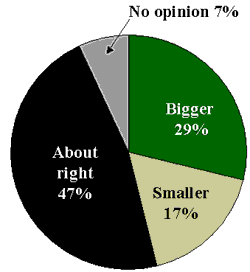
The majority of Americans are either content with the size of the tax cut or prefer an even larger one, regardless of calls to scale back or repeal it. Forty-seven percent say the tax cut was "about right," 29% say it should have been bigger than it was, and only 17% agree with critics that it should have been smaller than it was.
| Just your opinion, do you think the tax cut should have been -- bigger than it was, smaller than it was, or was it about right the way it was passed into law? |
 |
| August 16-19, 2001 |
Here again, most key subgroups believe that the tax cut should have been -- if anything -- bigger than it was. Even liberals are divided in their view -- 27% think it should have been smaller and an equal percentage think it should have been bigger. One exception is among high-income respondents. Those whose household income is $75,000 or more are actually slightly more likely to say the tax cut should have been smaller (32%) rather than bigger (25%). In all other income groups, more say the tax cut should have been bigger than smaller.
Bush Job Approval Ratings Unchanged
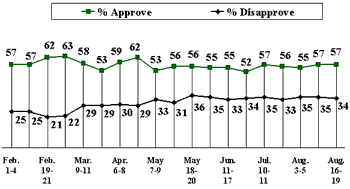
President Bush's job approval ratings remain steady despite the recent criticism of the tax cut, which was a key element of his campaign platform, and his budget projections, which some Democrats charge are inaccurate and rely on accounting "tricks." Bush's latest approval rating is 57%, unchanged from the prior week, and about the same as it has been throughout July and August. Currently, 34% disapprove of Bush, also similar to his recent scores.
| Do you approve or disapprove of the way George W. Bush is handling his job as president? |
 |
Congressional Job Approval Ratings Slightly Better
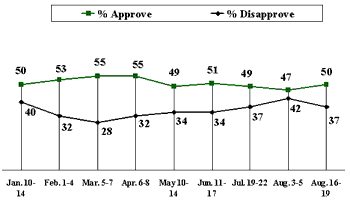
A divided Congress, with Republicans controlling the House and Democrats having just assumed control of the Senate in late May, passed the tax cut earlier this summer. The latest approval rating for Congress is 50%, up slightly from a 47% score earlier this month, while disapproval ratings are at 37%, down from 42% a few weeks ago. Ratings of Congress this year have varied, from a high of 55% in March and April, to a low of 47% this month, but are generally higher than they have been in previous years.
| Do you approve or disapprove of the way Congress is handling its job? |
 |
Currently, a majority of both Republicans (65%) and Democrats (55%) approve of the job Congress is doing. Independents' evaluations are more negative, with 46% disapproving and just 35% approving.
Survey Methods
These results are based on telephone interviews with a randomly selected national sample of 1,013 adults, 18 years and older, conducted August 16-19, 2001. For results based on this sample, one can say with 95 percent confidence that the maximum error attributable to sampling and other random effects is plus or minus 3 percentage points. In addition to sampling error, question wording and practical difficulties in conducting surveys can introduce error or bias into the findings of public opinion polls.
Finally, as part of the tax cut that became law earlier this year, the federal government is sending checks for about $300 to $600 to most people who paid taxes this year.
Do you think that the new tax cut law [ROTATED: will be a good thing for the country, will not make much difference, or will be a bad thing for the country]?
|
|
|
Not make |
|
No |
|
|
2001 Aug 16-19 |
36% |
44 |
17 |
3 |
|
|
2001 Jul 19-22 ^ |
40% |
39 |
18 |
3 |
|
|
^ |
Based on half sample. |
||||
Just your opinion, do you think the tax cut should have been -- [ROTATED: bigger than it was, smaller than it was] -- or was it about right the way it was passed into law?
|
|
Bigger |
Smaller |
About right |
No opinion |
|
2001 Aug 16-19 |
29% |
17 |
47 |
7 |
Do you approve or disapprove of the way George W. Bush is handling his job as president?
|
Approve |
Disapprove |
No opinion |
|
|
% |
% |
% |
|
|
(NA) 2001 Aug 16-19 |
57 |
34 |
9 |
|
(NA) 2001 Aug 10-12 |
57 |
35 |
8 |
|
(NA) 2001 Aug 3-5 |
55 |
35 |
10 |
|
(NA) 2001 Jul 19-22 |
56 |
33 |
11 |
|
(NA) 2001 Jul 10-11 |
57 |
35 |
8 |
|
(NA) 2001 Jun 28-Jul 1 |
52 |
34 |
14 |
|
(NA) 2001 Jun 11-17 |
55 |
33 |
12 |
|
(NA) 2001 Jun 8-10 |
55 |
35 |
10 |
|
(NA) 2001 May 18-20 |
56 |
36 |
8 |
|
(NA) 2001 May 10-14 |
56 |
31 |
13 |
|
(NA) 2001 May 7-9 |
53 |
33 |
14 |
|
(NA) 2001 Apr 20-22 |
62 |
29 |
9 |
|
(NA) 2001 Apr 6-8 |
59 |
30 |
11 |
|
(NA) 2001 Mar 26-28 |
53 |
29 |
18 |
|
(NA) 2001 Mar 9-11 |
58 |
29 |
13 |
|
(NA) 2001 Mar 5-7 |
63 |
22 |
15 |
|
(NA) 2001 Feb 19-21 |
62 |
21 |
17 |
|
(NA) 2001 Feb 9-11 |
57 |
25 |
18 |
|
(NA) 2001 Feb 1-4 |
57 |
25 |
18 |
Do you approve or disapprove of the way Congress is handling its job?
|
|
|
|
No |
Ap- |
|
No |
||
|
% |
% |
% |
% |
% |
% |
|||
|
2001 |
1996 |
|||||||
|
2001 Aug 16-19 |
50 |
37 |
13 |
1996 May 9-12 |
30 |
65 |
5 |
|
|
1996 Apr 9-10 |
35 |
57 |
8 |
|||||
|
2001 Aug 3-5 |
47 |
42 |
11 |
1995 |
||||
|
2001 Jul 19-22 |
49 |
37 |
14 |
1995 Sep 22-24 |
30 |
61 |
9 |
|
|
2001 Jun 11-17 |
51 |
34 |
15 |
1995 Aug 28-30 |
30 |
60 |
10 |
|
|
2001 May 10-14 |
49 |
34 |
17 |
1995 Jul 7-9 |
35 |
55 |
10 |
|
|
2001 Apr 6-8 |
55 |
32 |
13 |
1995 May 11-14 |
34 |
57 |
9 |
|
|
2001 Mar 5-7 |
55 |
28 |
17 |
1995 Apr 17-19 |
37 |
54 |
9 |
|
|
2001 Feb 1-4 |
53 |
32 |
15 |
1995 Mar 27-29 |
31 |
61 |
8 |
|
|
2001 Jan 10-14 |
50 |
40 |
10 |
1995 Mar 17-19 |
32 |
59 |
9 |
|
|
2000 |
1995 Feb 24-26 |
35 |
53 |
12 |
||||
|
2000 Dec 2-4 |
56 |
34 |
10 |
1995 Feb 3-5 |
38 |
53 |
9 |
|
|
2000 Oct 6-9 |
49 |
42 |
9 |
1995 Jan 16-18 |
33 |
52 |
15 |
|
|
2000 Aug 29-Sep 5 |
48 |
42 |
10 |
1994 |
||||
|
2000 May 18-21 |
39 |
52 |
9 |
1994 Dec 28-30 |
23 |
66 |
11 |
|
|
2000 Jan 7-10 |
51 |
42 |
7 |
1994 Oct 22-25 |
23 |
70 |
7 |
|
|
1999 |
1994 Oct 7-9 |
21 |
73 |
6 |
||||
|
1999 Sep 23-26 |
37 |
56 |
7 |
1994 Jul 15-17 |
27 |
65 |
8 |
|
|
1999 Jul 13-14 |
39 |
51 |
10 |
1994 Mar 25-27 |
29 |
63 |
8 |
|
|
1999 Jun 11-13 |
41 |
53 |
6 |
1994 Feb 26-28 |
28 |
66 |
6 |
|
|
1999 Apr 13-14 |
45 |
47 |
8 |
1993 |
||||
|
1999 Feb 12-13 |
41 |
54 |
5 |
1993 Nov 2-4 |
24 |
69 |
8 |
|
|
1999 Jan 15-17 |
50 |
46 |
4 |
1993 Aug 8-10 |
23 |
69 |
8 |
|
|
1998 |
1993 Jul 19-21 |
24 |
65 |
11 |
||||
|
1998 Dec 15-16 |
42 |
52 |
6 |
1993 Feb 26-28 |
27 |
54 |
19 |
|
|
1998 Nov 13-15 |
41 |
54 |
5 |
1992 |
||||
|
1998 Oct 29-Nov 1 |
44 |
47 |
9 |
1992 Mar 3 ^ |
18 |
78 |
3 |
|
|
1998 Oct 9-12 |
47 |
46 |
7 |
1991 |
||||
|
1998 Oct 6-7 |
44 |
48 |
8 |
1991 Oct 10-13 |
40 |
54 |
6 |
|
|
1998 Sep 11-12 |
55 |
36 |
9 |
1991 Jul 25-28 |
32 |
53 |
15 |
|
|
1998 May 8-10 |
44 |
48 |
8 |
1990 |
||||
|
1998 Apr 17-19 |
49 |
40 |
11 |
1990 Nov 2-4 |
26 |
63 |
11 |
|
|
1998 Feb 13-15 |
57 |
33 |
10 |
1990 Oct 25-28 |
24 |
68 |
8 |
|
|
1998 Jan 30-Feb 1 |
56 |
35 |
9 |
1990 Oct 18-21 |
23 |
64 |
13 |
|
|
1998 Jan 16-18 |
42 |
47 |
11 |
1990 Oct 11-14 |
28 |
65 |
7 |
|
|
1997 |
1988 |
|||||||
|
1997 Dec 18-21 |
39 |
52 |
9 |
1988 Sep 9-11 |
42 |
42 |
16 |
|
|
1997 Oct 27-29 |
36 |
53 |
11 |
1987 |
||||
|
1997 Aug 22-25 |
41 |
48 |
11 |
1987 Aug 24-Sep 2 |
42 |
49 |
9 |
|
|
1997 Jul 25-27 |
34 |
57 |
9 |
1986 |
||||
|
1997 May 6-7 |
32 |
58 |
10 |
1986 Apr 11-14 |
42 |
37 |
21 |
|
|
1997 Apr 18-20 |
30 |
59 |
11 |
1983 |
||||
|
1997 Feb 24-26 |
37 |
48 |
15 |
1983 Apr 29-May 2 |
33 |
43 |
24 |
|
|
1997 Jan 31-Feb 2 |
36 |
51 |
13 |
1982 |
||||
|
1997 Jan 10-13 |
41 |
49 |
10 |
1982 Jun 11-14 |
29 |
54 |
17 |
|
|
1996 |
1981 |
|||||||
|
1996 Oct 26-29 |
34 |
51 |
15 |
1981 Jun 19-22 |
38 |
40 |
22 |
|
|
1996 Aug 5-7 |
39 |
49 |
12 |
|
|
Approve |
|
No |
|
% |
% |
% |
|
|
1980 |
|||
|
1980 Jun 13-16 |
25 |
56 |
19 |
|
1979 |
|||
|
1979 Jun 1-4 |
19 |
61 |
20 |
|
1978 |
|||
|
1978 Sep 8-11 |
29 |
49 |
22 |
|
1977 |
|||
|
1977 Sep 9-12 |
35 |
44 |
21 |
|
1977 Aug 5-8 |
36 |
44 |
20 |
|
1977 Jun 3-6 |
34 |
42 |
24 |
|
1977 May 20-23 |
40 |
40 |
20 |
|
1977 Mar 25-28 |
36 |
42 |
22 |
|
1976 |
|||
|
1976 Jan 23-26 |
24 |
58 |
18 |
|
1975 |
|||
|
1975 Oct 31-Nov 3 |
28 |
54 |
18 |
|
1975 Jun 27-30 |
29 |
54 |
17 |
|
1975 Apr 18-21 |
38 |
48 |
14 |
|
1975 Feb 28-Mar 3 |
32 |
50 |
18 |
|
1974 |
|||
|
1974 Oct 11-14 |
35 |
43 |
22 |
|
1974 Aug 16-19 |
30 |
47 |
23 |
|
1974 Apr 12-15 |
30 |
47 |
23 |
|
^ Gallup/Newsweek |
|||
