###Embeddable###
###Embeddable###
###Embeddable###
###Embeddable###
###Embeddable###
###Embeddable###
###Embeddable###
###Embeddable###
###Embeddable###
###Embeddable###
###Embeddable###
###Embeddable###
###Embeddable###
###Embeddable###
###Embeddable###
###Embeddable###
###Embeddable###
###Embeddable###
###Embeddable###
###Embeddable###
###Embeddable###
###Embeddable###
###Embeddable###
Big Business > Satisfaction Size Influence Corporations January Table Very satisfied Somewhat satisfied Somewhat dissatisfied Very dissatisfied No opinion % % % % % 2026 5 17 25 49 3 2025 4 21 27 45 3 2024 4 20 30 42 3 2023 5 22 27 44 2 2022 4 22 32 42 * 2021 4 22 31 42 1 2020 8 33 26 32 1 2019 8 29 24 36 3 2018 6 28 28 36 2 2017 6 33 26 32 2 2016 5 30 31 32 2 2015 6 30 28 31 4 2014 5 30 30 32 3 2013 7 28 30 31 4 2012 4 26 28 36 5 2011 5 24 31 36 4 2008 6 29 28 33 3 2007 8 31 28 30 3 2006 6 29 30 32 2 2005 7 31 32 27 3 2004 7 31 34 27 1 2003 6 37 33 21 3 2002 7 43 30 17 3 2001 7 41 31 17 4
Big Business > Influence Corporations More Less January Table Total satisfied Dissatisfied, want more Dissatisfied, want less Dissatisfied, remain same No opinion % % % % % 2026 22 4 63 7 3 2022 26 3 62 9 * 2018 34 5 50 9 2 2017 39 4 46 8 2 2016 35 4 49 10 2 2015 36 4 46 9 4 2014 35 6 47 9 2 2013 35 6 46 9 4 2012 30 6 49 9 5 2011 29 5 54 9 4 2008 35 2 53 7 3 2007 39 3 46 9 3 2006 35 3 52 7 2 2005 38 2 48 9 3 2004 38 3 49 9 1 2003 43 3 42 9 3 2002 50 2 38 7 3 2001 48 3 37 8 4
Big Business > Satisfaction Govt Regulation of Business January Table Very satisfied Somewhat satisfied Somewhat dissatisfied Very dissatisfied No opinion % % % % % 2026 5 28 31 27 10 2025 6 28 29 27 11 2024 6 24 30 26 14 2023 6 25 30 26 13 2022 5 23 29 31 11 2021 5 31 30 22 12 2020 9 32 26 19 13 2019 7 32 29 20 13 2018 6 31 29 22 12 2017 8 30 27 24 11 2016 5 28 26 29 12
Big Business > Govt Regulation Business More Less January Table Total satisfied Dissatisfied, want increase Dissatisfied, want decrease Dissatisfied, remain same No opinion % % % % % 2026 33 29 20 9 10 2025 34 21 26 9 10 2023 31 18 27 10 13 2022 28 18 29 13 11 2021 36 23 17 12 12 2020 41 19 18 8 13 2018 37 23 18 10 12 2017 38 17 23 11 11 2016 32 20 25 10 12
Big Business > Biggest Threat Table Big business Big labor Big government No opinion % % % % 2025 Dec 1-15 37 5 57 1 2016 Dec 7-11 26 5 67 2 2015 Dec 2-6 25 6 69 1 2013 Dec 5-8 21 5 72 2 2011 Nov 28-Dec 1 26 8 64 2 2009 Mar 27-29 32 10 55 3 2008 Dec 4-7 31 11 53 6 2006 Dec 11-14 25 9 61 5 2005 Dec 5-7 27 8 61 4 2004 Dec 5-8 27 11 57 5 2003 Nov 10-12 29 9 57 5 2002 Jul 5-8 38 10 47 5 2000 Oct 25-28 22 7 65 6 1999 Aug 24-26 24 8 65 3 1998 Dec 4-6 24 7 64 5 1995 Aug 11-14 24 9 64 3 1985 Jun 7-10 22 19 50 9 1983 May 13-16 19 18 51 12 1981 Sep 18-21 22 22 46 10 1979 May 4-7 28 17 43 12 1978 Sep 15-18 19 19 47 15 1977 Jan 7-10 23 26 38 13 1969 Nov 12-17 19 28 33 20 1968 Jul 18-23 12 26 46 16 1966 Dec 8-13 14 21 48 17 1965 Feb 17 29 35 19
Big Business > Too Much Too Little Government Regulation Business Industry Table Too much Too little Right amount No opinion % % % % 2025 Sep 2-16 42 29 26 4 2024 Sep 3-15 42 27 28 3 2023 Sep 1-23 44 25 31 1 2022 Sep 1-16 46 23 29 2 2021 Sep 1-17 43 25 30 2 2020 Aug 31-Sep 13 36 27 36 1 2019 Sep 3-15 38 28 33 1 2018 Sep 4-12 39 25 33 3 2017 Sep 6-10 45 23 29 3 2016 Sep 7-11 47 22 27 4 2015 Sep 9-13 49 21 27 2 2014 Sep 4-7 49 22 27 3 2013 Sep 5-8 48 23 26 3 2012 Sep 6-9 47 26 24 3 2011 Sep 8-11 50 24 23 3 2010 Sep 13-16 49 27 21 3 2009 Aug 31-Sep 2 45 24 27 3 2008 Sep 8-11 38 27 31 3 2007 Sep 14-16 38 26 33 4 2006 Sep 7-10 36 28 30 6 2005 Sep 12-15 34 23 40 3 2004 Sep 13-15 37 24 34 5 2003 Sep 8-10 37 25 35 3 2002 Sep 5-8 35 31 31 3 2002 Jun 28-30 32 33 30 5 2002 Feb 8-10 28 30 39 3 2001 Sep 7-10 41 17 38 4 1993 Mar 22-24 37 28 30 5
Big Business > View of Business Socialism Table Positive Negative No opinion % % % <b>Free enterprise 2025 Aug 1-20 81 15 4 2021 Oct 1-19 84 13 2 2019 Oct 1-13 87 10 3 2018 Jul 30-Aug 5 79 17 4 2016 May 2-4 85 9 6 2012 Nov 18-19 89 7 4 2010 Jan 26-27 86 10 4 <b>Big business 2025 Aug 1-20 37 62 2 2021 Oct 1-19 46 53 1 2019 Oct 1-13 52 48 * 2018 Jul 30-Aug 5 50 49 2 2016 May 2-4 53 43 4 2012 Nov 18-19 58 39 3 2010 Jan 26-27 49 49 2 <b>Small business 2025 Aug 1-20 95 4 1 2021 Oct 1-19 97 3 * 2019 Oct 1-13 97 3 * 2018 Jul 30-Aug 5 92 7 1 2016 May 2-4 96 3 1 2012 Nov 18-19 95 4 1 2010 Jan 26-27 95 4 1 <b>Capitalism 2025 Aug 1-20 54 42 4 2021 Oct 1-19 60 38 2 2019 Oct 1-13 60 35 4 2018 Jul 30-Aug 5 56 40 4 2016 May 2-4 60 34 5 2012 Nov 18-19 61 31 8 2010 Jan 26-27 61 33 7 <b>Socialism 2025 Aug 1-20 39 57 4 2021 Oct 1-19 38 59 3 2019 Oct 1-13 39 57 3 2018 Jul 30-Aug 5 37 58 5 2016 May 2-4 35 58 7 2012 Nov 18-19 39 54 8 2010 Jan 26-27 36 58 6 <b>The federal government 2021 Oct 1-19 38 62 1 2019 Oct 1-13 38 60 2 2018 Jul 30-Aug 5 39 59 2 2016 May 2-4 44 52 3 2012 Nov 18-19 51 46 3 2010 Jan 26-27 46 51 3 <b>Entrepreneurs 2019 Oct 1-13 90 8 1 2018 Jul 30-Aug 5 86 11 2 2016 May 2-4 87 9 4 2012 Nov 18-19 86 10 5 2010 Jan 26-27 84 10 6
Big Business > Confidence in Institutions Table Great deal Quite a lot Some Very little None (vol.) No opinion % % % % % % <b>Big business 2026 Jun 1-15 6 11 34 46 2 1 2025 Jun 2-26 5 10 36 43 3 2 2024 Jun 3-23 6 10 42 41 1 1 2023 Jun 1-22 5 9 42 42 1 1 2022 Jun 1-20 4 10 43 40 1 1 2021 Jun 1-Jul 5 9 9 41 38 3 1 2020 Jun 8-Jul 24 7 12 45 33 3 1 2019 Jun 3-16 10 13 41 32 2 * 2018 Jun 1-13 10 15 43 29 1 1 2017 Jun 7-11 9 12 38 36 3 1 2016 Jun 1-5 6 12 43 36 2 1 2015 Jun 2-7 9 12 41 34 3 1 2014 Jun 5-8 9 12 38 35 5 2 2013 Jun 1-4 9 13 43 31 2 2 2012 Jun 7-10 9 12 40 34 4 2 2011 Jun 9-12 8 11 41 35 4 2 2010 Jul 8-11 7 12 42 35 3 1 2009 Jun 14-17 6 10 42 36 5 1 2008 Jun 9-12 7 13 43 32 3 2 2007 Jun 11-14 7 11 39 38 3 2 2006 Jun 1-4 6 12 40 36 4 2 2005 May 23-26 8 14 45 29 2 2 2004 May 21-23 7 17 42 30 3 1 2003 Jun 9-10 8 14 44 31 2 1 2002 Jun 21-23 7 13 47 29 3 1 2001 Jun 8-10 10 18 44 23 3 2 2000 Jun 22-25 9 20 45 22 2 2 1999 Jun 25-27 11 19 44 24 1 1 1998 Jun 5-7 ^ 11 19 43 23 2 2 1997 Jul 25-27 11 17 43 24 3 2 1996 May 28-29 7 17 46 26 2 2 1995 Apr 21-24 8 13 50 24 2 3 1994 Mar 25-29 9 17 42 28 2 2 1993 Mar 22-24 7 16 44 28 3 2 1991 Oct 10-13 7 15 42 30 2 4 1991 Feb 28-Mar 3 11 15 45 22 3 4 1990 Aug 16-19 9 16 40 28 3 4 1988 Sep 23-26 7 18 42 26 4 3 1986 Jul 11-14 7 21 40 26 2 4 1985 May 17-20 8 24 41 22 2 4 1984 Oct 6-10 9 20 39 28 -- 4 1983 Aug 5-8 7 21 39 26 2 5 1981 Nov 20-23 6 14 36 29 11 3 1979 Apr 6-9 11 21 37 26 2 3 1977 Jan 7-10 11 21 35 25 2 6 1975 May 30-Jun 2 10 24 36 23 2 5 1973 May 4-7 10 16 36 20 9 8 <b>Small business 2026 Jun 1-15 33 34 27 5 * 1 2025 Jun 2-26 32 38 24 5 * 1 2024 Jun 3-23 36 32 25 6 * 1 2023 Jun 1-22 29 36 28 7 * * 2022 Jun 1-20 28 40 25 6 -- 1 2021 Jun 1-Jul 5 35 35 24 7 * * 2020 Jun 8-Jul 24 38 37 19 6 * * 2019 Jun 3-16 34 34 24 8 * * 2018 Jun 1-13 32 35 26 6 * * 2017 Jun 7-11 33 37 23 7 * * 2016 Jun 1-5 30 38 24 7 * * 2015 Jun 2-7 34 33 26 6 * 1 2014 Jun 5-8 29 33 27 10 1 1 2013 Jun 1-4 29 36 27 7 * 1 2012 Jun 7-10 30 33 29 6 * 1 2011 Jun 9-12 28 36 26 8 * 1 2010 Jul 8-11 30 36 26 6 * 1 2009 Jun 14-17 30 37 26 7 * 1 2008 Jun 9-12 28 32 31 7 * 2 2007 Jun 11-14 24 35 32 7 * 2 1998 Jun 5-7 ^ 25 32 34 9 0 1 1997 Jul 25-27 32 31 29 5 1 2
Big Business > New Products Table Big businesses Small businesses Both equally (vol.) No opinion % % % % 2014 Apr 30-May 1 35 60 2 2
Big Business > Job Large Companies Doing Table Very good Good Poor Very poor No opinion % % % % % <b>Creating important new products and technologies? 2014 Apr 30-May 1 17 62 16 3 2 <b>Creating good jobs for citizens in other countries where U.S. companies do business? 2014 Apr 30-May 1 10 56 22 4 8 <b>Creating better lives for people in communities outside the U.S. where U.S. companies do business? 2014 Apr 30-May 1 8 48 27 7 10 <b>Promoting U.S. values and ideals around the world? 2014 Apr 30-May 1 6 43 37 9 5 <b>Protecting the environment? 2014 Apr 30-May 1 6 42 41 9 2 <b>Helping grow the U.S. economy? 2014 Apr 30-May 1 5 39 44 10 2 <b>Creating good jobs for Americans? 2014 Apr 30-May 1 6 37 41 13 2 <b>Balancing the best interests of the U.S. and Americans with the best interests of the company? 2014 Apr 30-May 1 5 38 42 12 5
27286 > A-Z Webpart > T > Government > Groups Too Much Power Table Too much About right Not enough No opinion % % % % Lobbyists 71 13 8 8 Major corporations 67 21 9 3 Banks and financial institutions 67 23 8 2 The federal government in Washington 58 30 9 3 Labor unions 43 28 24 4 The government in your state 34 49 15 2 The courts, legal system and judges 34 49 14 3 Organized religion and churches 25 46 24 4 The municipal or local government where you live 22 53 21 3 The military 14 53 28 4
Big Business > Influence Bush Administration Table Yes, does No, does not No opinion % % % 2006 Feb 28-Mar 1 73 23 4 2005 Aug 28-30 70 25 5 2004 Oct 9-10 ^ 61 35 4 2002 Jul 26-28 ^ 69 24 7 2002 Jun 28-30 ^ 63 32 5 2002 Jan 11-14 63 31 6 2001 Jul 10-11 67 26 7 2001 Apr 20-22 63 30 7
Big Business > Confidence Accurate Info Company Finances Table Great deal Moderate amount Not much None at all No opinion % % % % % 2002 Jul 29-31 7 37 35 19 2
Big Business > Executives Improper Actions Table Very widespread Somewhat widespread Happens occasionally Never happens No opinion % % % % % 2002 Jul 29-31 43 39 14 1 3
Big Business > Corporate Corruption Worse Table Gotten worse Always like this No opinion % % % 2002 Jul 29-31 47 50 3
Big Business > Regulation Corporate Corruption Table Do you think that new legislation and increased regulation of business can have a major effect on correcting the problem of corporate corruption, or not? Yes, can No, cannot No opinion % % % 2002 Jul 29-31 66 30 4
Big Business > Confident Accounting Audits Table Very confident Somewhat confident Not too confident Not confident at all No opinion % % % % % 2002 Jul 26-28 3 32 41 22 2 2002 Feb 8-10 7 49 31 11 2
Big Business > Reforms Accounting Audits Table Overhaul Major reforms Minor reforms No reforms No opinion % % % % % 2002 Jul 26-28 28 43 22 3 4 2002 Feb 8-10 17 39 35 4 5
Big Business > New Corporate Laws Needed Table New laws needed Enforce existing laws more strictly No opinion % % % 2002 Jun 28-30 27 69 4
Big Business > Crisis Corporate Misconduct Table Crisis Major problem Minor problem Not a problem No opinion % % % % % 2002 Jun 28-30 20 57 17 3 3
Big Business > Decreased Regulation Scandals Table Great deal Moderate amount Not much Not at all No opinion % % % % % 2002 Jun 28-30 26 44 18 8 4
Big Business > Actions Enron Officials Table Illegal Unethical, not illegal Not anything wrong No opinion % % % % 2002 Feb 8-10 65 26 2 7 2002 Jan 25-27 65 17 2 16 2002 Jan 11-14 42 29 6 23
Big Business > Actions Enron Officials Worse Table Worse No worse No opinion % % % 2002 Feb 8-10 42 52 6
Recommended
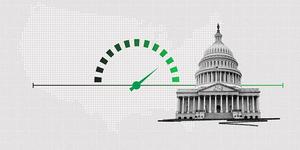
A reduced majority of Americans view "big government" as most threatening to the future of the U.S., while a near record-high 37% say "big business" is.
Views that the federal government has too much power are now slightly higher than in previous years.
About four in 10 Americans are consistently aware of where the products they buy are made.
Sixty-nine percent of U.S. adults say it is extremely or somewhat important for businesses to promote DEI, the lowest level since tracking began in 2022.
Gallup https://news.gallup.com/poll/5248/big-business.aspx Gallup World Headquarters, 901 F Street, Washington, D.C., 20001, U.S.A