Recent Gallup polling has shown that the "rally effect" that boosted public approval ratings for several government figures following the Sept. 11 attacks has largely subsided (see "Rally Effect of 9/11 Terrorist Attacks Virtually Gone" in Related Items). Approval ratings for both President Bush and Congress have steadily declined from record-breaking levels, and Americans' trust in government is now at levels more typical of recent history. But as the mid-term elections approach, how are Americans feeling with regard to the more direct question about how they are being governed?
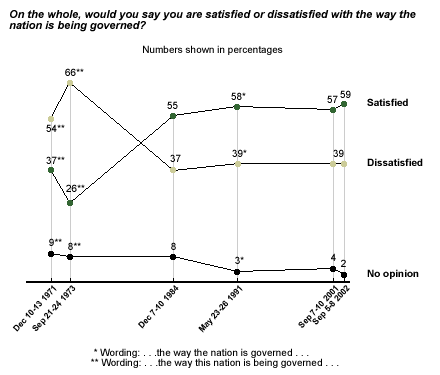
Fifty-nine percent of Americans say they are satisfied with the way the nation is being governed, while 39% are dissatisfied. Just prior to the attacks (Sept. 7-10, 2001), the numbers stood at 57% satisfied and 39% dissatisfied. Over the past three decades, these numbers have remained fairly consistent. However, during the early 1970s -- years in which the Vietnam War grew intensely unpopular at home and the Watergate scandal was exposed -- Americans were much more likely to be dissatisfied with the way the nation was being governed than they are today. Specifically, in 1973 more than twice as many Americans said they were dissatisfied (66%) as said they were satisfied (26%).

Satisfaction by Political Party
Not surprisingly, given that a Republican president currently occupies the White House, Republicans are currently twice as likely to be satisfied with how the nation is being governed than Democrats are. An overwhelming majority of Republicans, 81%, are satisfied, compared to 41% of Democrats. Less than a fifth of Republicans (17%) are dissatisfied, while more than half of Democrats (58%) report that they are dissatisfied with the way the nation is being governed.
Satisfaction by Age
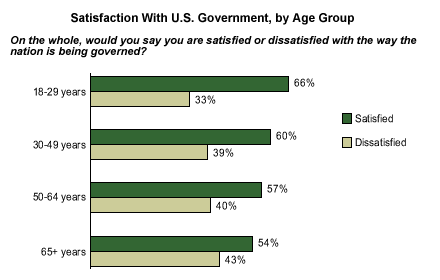
Younger Americans between the ages of 18 and 29 are most likely to be satisfied with the way the nation is being governed. Twice as many respondents in this age group are satisfied (66%) as are dissatisfied (33%). On the other hand, senior citizens (aged 65 and older) are the least likely to be satisfied with the governance of the country (54%), followed closely by 50- to 64-year-olds (57%).

Satisfaction by Community and Income
While there are no meaningful differences in satisfaction levels regionally, there is substantial variance by type of community. Americans who live in the suburbs (63%) are more likely to report being satisfied with how the country is governed than urban dwellers (53%).
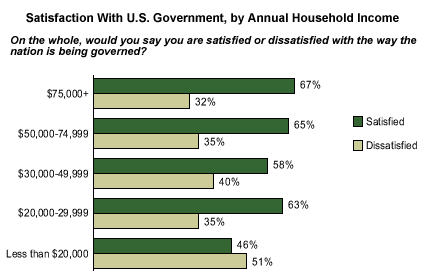
Satisfaction also differed according to household income level. Sixty-seven percent of those earning more than $75,000 a year are satisfied with the manner in which the country is governed, compared to 46% of those earning less than $20,000 a year.

Key Points
Responses to this question contain good news and bad news for Republicans this election season. The bad news is that, like other approval measures, Americans' satisfaction with the way they are being governed is now comparable to pre-Sept. 11 levels. The good news is that those levels are still fairly high. Whether the glass is half empty or half full is a matter of personal interpretation, but in broad terms it seems to be a positive sign that Americans continue to feel secure about how the country is being run.
*Results are based on telephone interviews with 1,004 national adults, conducted Sept. 5-8, 2002. For results based on the total sample of national adults, one can say with 95% confidence that the maximum margin of sampling error is ±3%.
