GALLUP NEWS SERVICE
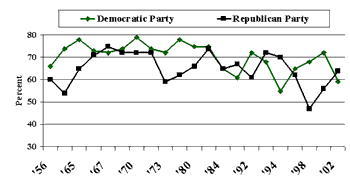
PRINCETON, NJ -- Americans are divided over whether the recent congressional elections, which gave Republicans majority control of both houses of Congress, represent a good or bad thing for the country -- with a plurality of the public taking a middle position. Still, for several different issue areas, Americans express mild optimism that things are more likely to be better rather than worse under Republican control. Also, the public's rating of the two major parties shows Americans to be a little more positive about the Republican than the Democratic Party. The long-term trend in party ratings shows much volatility, with both parties usually receiving favorable ratings from at least half the public.
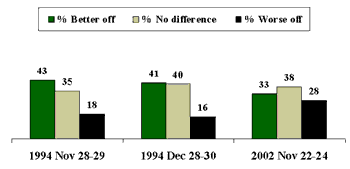
These findings are based on a CNN/USA Today/Gallup poll conducted Nov. 22-24, which shows that 33% of Americans think the country will be better off because the Republicans now control Congress, while 28% say the country will be worse off. A plurality, 38%, however, says that Republican control will not make any difference.
| With Republican Control of Congress, Country Will Be ... ? |
 |
After the midterm elections in 1994, when Republicans won majority control of the U.S. House of Representatives for the first time in four decades, Americans expressed a more lopsided view. In a December 1994 survey, 41% said the country would be better off with Republicans controlling Congress, and just 16% said worse off. Still, close to a plurality, 40%, said the GOP victory would make no difference. These results were similar to those found in a November 1994 survey.
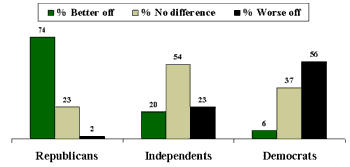
Not surprisingly, party affiliation greatly affects how people assess the country's well-being under GOP control. Republicans say the United States will be better off rather than worse off by a 74% to 2% margin, while Democrats take the opposite point of view by a 56% to 6% margin. Independents are truly ambivalent, with 20% saying better off, 23% worse off, and a majority -- 54% -- saying the change will make no difference.
| With Republican Control of Congress, Country Will Be ... ? Compared by Party |
 |
| 2002 Nov 22-24 |
While the general reaction to the GOP victory is ambivalent, Americans express mostly optimistic views that on a series of issues, Republicans will make things better rather than worse. On only one issue, the war against terrorism, do Americans express rather intense views, while on all others they are more likely to say things will be "a little better" than "a lot better."
Regardless of the effect that Republican control of the White House and both houses of Congress will have on the country as a whole, do you think that in the next two years the Republicans will make things -- [ROTATED: a lot better, a little better, a little worse, (or) a lot worse] -- in each of the following areas? How about -- [RANDOM ORDER]?
|
A lot better |
A little better |
SAME (vol.) |
A little worse |
A lot worse |
|
|
% |
% |
% |
% |
% |
|
|
War on terrorism |
33 |
34 |
4 |
13 |
13 |
|
Education |
16 |
46 |
9 |
19 |
8 |
|
The economy |
14 |
43 |
5 |
24 |
13 |
|
Decisions made by the Supreme Court/other |
14 |
39 |
10 |
19 |
13 |
|
Healthcare |
9 |
39 |
8 |
26 |
16 |
|
The environment |
9 |
32 |
10 |
26 |
21 |
|
Medicare and Social |
9 |
31 |
9 |
27 |
21 |
|
(vol.) Volunteered response |
|||||
SUMMARY TABLE: BETTER OR WORSE WITH REPUBLICAN CONTROL OF GOVERNMENT
|
2002 Nov 22-24 |
Total |
Total |
|
% |
% |
|
|
The war against terrorism |
67 |
26 |
|
Education |
62 |
27 |
|
The economy |
57 |
37 |
|
The decisions made by |
53 |
32 |
|
Healthcare |
48 |
42 |
|
The environment |
41 |
47 |
|
Medicare and Social Security |
40 |
48 |
Americans are least optimistic that Republicans will help the environment or make Medicare and Social Security better, with a plurality on each issue saying the issue will be worse under GOP control.
Party Ratings Show Republicans Enjoy Slight Advantage Over Democrats
The poll also shows that despite the generally positive views that Americans have about the GOP election victory, the Democrats are rated only slightly lower than the Republicans. On a scale from -5 to +5, 23% of Americans give Republicans a score of "4" or "5," compared with 17% who give these scores to Democrats. Four in 10 Americans also give each party a positive score between "1" and "3." That gives the Republicans a total favorable score of 64% to the Democrats' 59%.
| Favorable Ratings of Each Party 1956-2002 |
 |
The last time the party ratings were measured on this type of scale was in January 1999, just after House Republicans had voted to impeach President Bill Clinton. The impeachment itself was widely opposed by the American public. The current ratings show a significant improvement for the GOP since that time, while Democrats are viewed less favorably.
Survey Methods
The latest results are based on telephone interviews with 1,017 national adults, aged 18+, conducted Nov. 22-24, 2002. For results based on the total sample of national adults, one can say with 95% confidence that the margin of sampling error is ±3 percentage points. In addition to sampling error, question wording and practical difficulties in conducting surveys can introduce error or bias into the findings of public opinion polls.
Now that the Republicans have won control of Congress in this November's elections, do you think the country will be better off, worse off, or will it not make any difference?
|
Better |
Worse |
No differ- |
No |
||
|
% |
% |
% |
% |
||
|
2002 Nov 22-24 |
33 |
28 |
38 |
1 |
|
|
1994 Dec 28-30 |
41 |
16 |
40 |
3 |
|
|
1994 Nov 28-29 |
43 |
18 |
35 |
4 |
|
|
1994 Oct 7-9 ^ |
34 |
18 |
45 |
3 |
|
|
^ |
WORDING: If the Republicans win control of Congress, do you think the country will be better off, worse off, or will it not make any difference? |
||||
Regardless of the effect that Republican control of the White House and both houses of Congress will have on the country as a whole, do you think that in the next two years the Republicans will make things -- [ROTATED: a lot better, a little better, a little worse, (or) a lot worse] -- in each of the following areas? How about -- [RANDOM ORDER]?
|
A lot better |
A little |
SAME (vol.) |
A little |
A lot |
No |
|
|
% |
% |
% |
% |
% |
% |
|
|
War on terrorism |
33 |
34 |
4 |
13 |
13 |
3 |
|
The economy |
14 |
43 |
5 |
24 |
13 |
1 |
|
Healthcare |
9 |
39 |
8 |
26 |
16 |
2 |
|
Decisions made |
14 |
39 |
10 |
19 |
13 |
5 |
|
Education |
16 |
46 |
9 |
19 |
8 |
2 |
|
Medicare and |
9 |
31 |
9 |
27 |
21 |
3 |
|
The environment |
9 |
32 |
10 |
26 |
21 |
2 |
|
(vol.) Volunteered response |
||||||
Q.8 CONTINUED
SUMMARY TABLE: BETTER OR WORSE WITH REPUBLICAN CONTROL OF GOVERNMENT
|
2002 Nov 22-24 |
A lot |
Total |
Total |
|
% |
% |
% |
|
|
The war against terrorism |
33 |
67 |
26 |
|
Education |
16 |
62 |
27 |
|
The economy |
14 |
57 |
37 |
|
The decisions made by the Supreme Court |
14 |
53 |
32 |
|
Health care |
9 |
48 |
42 |
|
The environment |
9 |
41 |
47 |
|
Medicare and Social Security |
9 |
40 |
48 |
Next, I'd like you to rate the political parties on a scale. If you have a favorable opinion of the party, name a number between plus one and plus five -- the higher the number, the more favorable your opinion. If you have an unfavorable opinion of the party, name a number between minus one and minus five -- the higher the number the more unfavorable your opinion. First, how would you rate ... Next, how would you rate ... [ITEMS ROTATED]
A. The Republican Party
|
Highly favor- |
Moder- (+1,2,3) |
Moder- |
Highly unfavor- |
|
|
|
% |
% |
% |
% |
% |
|
|
(NA) 2002 Nov 22-24 |
23 |
41 |
19 |
14 |
3 |
|
(NA) 1999 Jan 15-17 |
18 |
38 |
22 |
17 |
5 |
|
(NA) 1998 Nov 13-15 |
9 |
38 |
25 |
15 |
13 |
|
(RV) 1996 Oct 26-29 |
25 |
38 |
20 |
13 |
4 |
|
(NA) 1996 Mar |
17 |
45 |
20 |
11 |
7 |
|
(NA) 1996 Feb |
21 |
41 |
20 |
13 |
5 |
|
(NA) 1996 Jan |
20 |
41 |
20 |
14 |
5 |
|
(NA) 1994 Nov 28-29 |
29 |
41 |
16 |
12 |
2 |
|
(NA) 1993 Dec 17-19 |
22 |
50 |
17 |
7 |
4 |
|
(NA) 1992 Dec 4-6 |
21 |
40 |
21 |
14 |
4 |
|
(NA) 1991 Oct |
18 |
47 |
17 |
11 |
7 |
|
(NA) 1991 Sep |
17 |
52 |
16 |
8 |
7 |
|
(NA) 1984 Sep |
26 |
39 |
15 |
14 |
6 |
|
(NA) 1981 Mar |
30 |
44 |
11 |
8 |
7 |
|
(NA) 1980 Oct |
18 |
47 |
19 |
11 |
5 |
|
(NA) 1980 May |
17 |
50 |
18 |
10 |
5 |
|
(NA) 1975 Nov |
15 |
47 |
20 |
14 |
4 |
|
(NA) 1973 Aug |
19 |
40 |
20 |
16 |
5 |
|
(NA) 1972 Oct |
29 |
43 |
14 |
9 |
5 |
|
(NA) 1970 Oct |
25 |
47 |
14 |
10 |
4 |
|
(NA) 1968 Dec |
25 |
42 |
17 |
13 |
3 |
|
(NA) 1968 Sep |
30 |
47 |
12 |
7 |
4 |
|
(NA) 1968 Jul |
27 |
43 |
16 |
9 |
5 |
|
(NA) 1968 May |
27 |
46 |
14 |
9 |
4 |
|
(NA) 1967 Oct |
34 |
39 |
15 |
8 |
4 |
|
(NA) 1967 Apr |
33 |
44 |
12 |
7 |
4 |
|
(NA) 1966 Dec |
28 |
41 |
15 |
7 |
9 |
|
(NA) 1966 Aug |
29 |
44 |
14 |
6 |
7 |
|
(NA) 1965 May |
26 |
39 |
12 |
7 |
16 |
|
(NA) 1964 Oct |
21 |
33 |
16 |
17 |
13 |
|
(NA) 1956 Oct |
33 |
29 |
13 |
12 |
13 |
|
(NA) 1956 Feb |
27 |
31 |
24 |
6 |
12 |
|
(NA) National Adults |
|||||
|
(RV) Registered Voters |
|||||
Q.6 CONTINUED
B. The Democratic Party
|
Highly favor- |
Moder- (+1,2,3) |
Moder- |
Highly unfavor- |
|
|||||
|
% |
% |
% |
% |
% |
|||||
|
(NA) 2002 Nov 22-24 |
17 |
42 |
25 |
13 |
3 |
||||
|
(NA) 1999 Jan 15-17 |
31 |
41 |
16 |
9 |
3 |
||||
|
(NA) 1998 Nov 13-15 |
27 |
41 |
17 |
12 |
3 |
||||
|
(RV) 1996 Oct 26-29 |
32 |
38 |
16 |
10 |
4 |
||||
|
(NA) 1996 Mar |
24 |
40 |
18 |
11 |
7 |
||||
|
(NA) 1996 Feb |
20 |
42 |
20 |
13 |
5 |
||||
|
(NA) 1996 Jan |
21 |
41 |
22 |
12 |
4 |
||||
|
(NA) 1994 Nov 28-29 |
18 |
37 |
26 |
18 |
1 |
||||
|
(NA) 1993 Dec 17-19 |
24 |
44 |
20 |
9 |
3 |
||||
|
(NA) 1992 Dec 4-6 |
29 |
43 |
15 |
8 |
5 |
||||
|
(NA) 1991 Oct |
16 |
42 |
22 |
13 |
7 |
||||
|
(NA) 1991 Sep |
16 |
47 |
21 |
8 |
8 |
||||
|
(NA) 1984 Sep |
26 |
39 |
18 |
9 |
8 |
||||
|
(NA) 1981 Mar |
34 |
41 |
12 |
6 |
7 |
||||
|
(NA) 1980 Oct |
27 |
46 |
15 |
7 |
5 |
||||
|
(NA) 1980 May |
28 |
48 |
14 |
6 |
4 |
||||
|
(NA) 1975 Nov |
30 |
48 |
13 |
5 |
4 |
||||
|
(NA) 1973 Aug |
29 |
43 |
15 |
9 |
4 |
||||
|
(NA) 1972 Oct |
30 |
44 |
14 |
6 |
6 |
||||
|
(NA) 1970 Oct |
35 |
44 |
11 |
6 |
4 |
||||
|
(NA) 1968 Dec |
41 |
33 |
15 |
6 |
5 |
||||
|
(NA) 1968 Sep |
32 |
38 |
17 |
10 |
3 |
||||
|
(NA) 1968 Jul |
36 |
37 |
14 |
8 |
5 |
||||
|
(NA) 1968 May |
42 |
36 |
12 |
7 |
3 |
||||
|
(NA) 1967 Oct |
31 |
35 |
18 |
14 |
2 |
||||
|
(NA) 1967 Apr |
40 |
37 |
11 |
7 |
5 |
||||
|
(NA) 1966 Dec |
33 |
37 |
13 |
9 |
8 |
||||
|
(NA) 1966 Aug |
36 |
40 |
10 |
7 |
7 |
||||
|
(NA) 1965 May |
44 |
34 |
7 |
4 |
11 |
||||
|
(NA) 1964 Oct |
45 |
29 |
10 |
5 |
11 |
||||
|
(NA) 1956 Oct |
38 |
25 |
12 |
10 |
15 |
||||
|
(NA) 1956 Feb |
43 |
26 |
22 |
6 |
3 |
||||
|
(NA) National Adults |
|||||||||
|
(RV) Registered Voters |
|||||||||
