GALLUP NEWS SERVICE
PRINCETON, NJ -- In the early 2004 Democratic primaries and caucuses, voters will be offered an unusually wide array of candidates who are not white Protestant males -- Senator Joseph Lieberman, a Jew; Senator John Kerry, a Catholic; Al Sharpton, an African-American; and former Senator Carol Moseley Braun, an African-American woman. And despite her announced decision not to run in 2004, Hillary Rodham Clinton tops the early polls among Democratic voters.
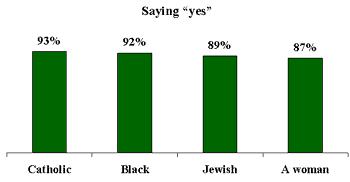
Over the past six and a half decades, Gallup polls show that the American public has become more willing to consider voting for candidates whose gender or race or religion might have disqualified them in an earlier period of American history. Today, about nine in 10 Americans say that if their party nominated a well-qualified presidential candidate who "happened to be" Jewish, or black, or Catholic, or a woman, they would vote for that person.
| If your party nominated a generally well-qualified person for president who happened to be ---, would you vote for that person? |
 |
| May 19-21, 2003 |
In 1937, when Gallup first asked about potential presidential candidates with diverse backgrounds, tolerance was not nearly as prevalent. Americans opposed the concept of a woman candidate by about a 2-to-1 margin, 64% to 33%.
| Vote for a Woman Candidate? |
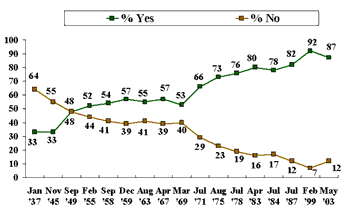 |
Then, two major shifts in opinion occurred -- after World War II and during the "second wave" of the feminist movement in the 1970s. By the mid-1950s, a majority of Americans expressed support for a female presidential candidate. Two decades later, about three-quarters did. In 1999, more than nine in 10 Americans said they would vote for a female candidate, though that number has dropped slightly to 87% in the latest poll.
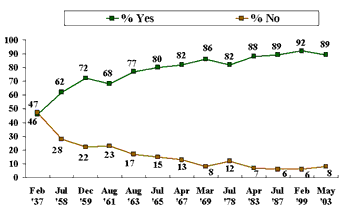
Support for a well-qualified Jewish presidential candidate has been generally stronger than support for a woman candidate. In 1937, Americans were evenly divided over the issue, 46% saying they would vote for a Jew and 47% saying they would not. In the mid-50s, support had grown to more than a 2-to-1 margin, and by the mid-1960s, support was up to the 80% level. In 2000, Connecticut Senator Joe Lieberman became the first Jewish candidate to appear on a major party's presidential ticket (as Al Gore's vice presidential nominee). He is currently campaigning for the 2004 Democratic Party presidential nomination.
| Vote for a Jewish Candidate? |
 |
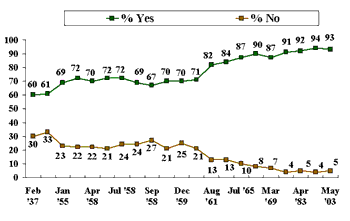
When Gallup first asked about a Catholic candidate in 1937, America had already been exposed to a Catholic presidential candidate, Al Smith, nominated by the Democratic Party in 1928. A decade or so later, Gallup's polling found American attitudes about a Catholic candidate more positive than negative, by 60% to 30%. Support increased to the 70% level before John F. Kennedy was elected president in 1960, after explicitly dealing with the "Catholic issue" during his campaign. Less than a year after his election, support jumped another 10 points, and a few years later it jumped yet another 10 points. It has remained in the 90% range for the past 35 years. If Massachusetts Senator John Kerry wins the nomination, he will be the first Catholic candidate of a major party since Kennedy.
| Vote for a Catholic Candidate? |
 |
Gallup did not even ask about voting for a black presidential candidate in 1937, perhaps indicating how remote a possibility it was at the time. When Gallup asked about a black presidential candidate for the first time in 1958, Americans said no by a 53% to 37% margin.
| Vote for a Black Candidate? |
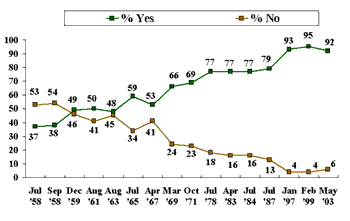 |
By the mid-60s, during a particularly contentious period of the civil rights movement, and after Congress and the president had passed significant legislation prohibiting racial discrimination, support for a black candidate rose to the majority level. By the 1970s, more than three-quarters of Americans indicated their willingness to vote for a black presidential candidate. And by the end of the 1990s, more than nine in 10 Americans expressed this willingness.
Today, no black candidate has ever been nominated as a major party's presidential or vice presidential candidate, though several have unsuccessfully sought their party's presidential nomination, including Democrats Jesse Jackson in 1984 and 1988 and Doug Wilder in 1992, and Republican Alan Keyes in 2000.
Little Change in Past Four Years
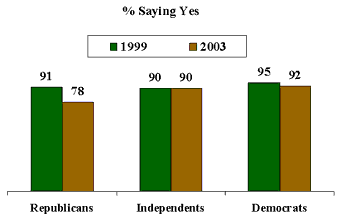
Compared with a similar poll in 1999, the current poll shows slightly lower percentages of support for each of the four categories of presidential candidate. However, only one decline, support for a woman candidate, is statistically significant -- the others fall within the margin of error of the polls.
The February 1999 poll shows 92% of Americans willing to vote for a woman, up from 82% who expressed that view in 1987. The current poll shows support five points lower than the 1999 survey, although still higher than the previous reading in 1987.
The change in support for a woman candidate has come mostly among Republicans. Currently, just 78% of Republicans say they would vote for a well-qualified female candidate nominated by their own party, compared with 91% of Republicans who said that in 1999 -- a decline of 13 percentage points. By contrast, independents show no change in their willingness to vote for a woman (90% each in the two polls), while Democrats show a slight decline of three points (95% in 1999 and 92% now).
| Vote for a Woman Candidate? |
 |
| May 19-21, 2003 |
One reason for the lower support among Republicans is that they may be thinking about the next presidential election, rather than elections in general. Given the high approval rating that President Bush enjoys, Republicans may be saying "no" to a woman candidate because they want Bush to be re-nominated. In February 1999, when support for a woman candidate was higher, Bush was not the GOP nominee, and Republican Elizabeth Dole was considered a potential candidate.
Survey Methods
Results are based on telephone interviews with 1,019 national adults, aged 18+, conducted May 30 through June 1, 2003. For results based on the total sample of national adults, one can say with 95% confidence that the margin of sampling error is ±3 percentage points. For results based on the 514 national adults in the Form A half-sample and 505 national adults in the Form B half-sample, the maximum margins of sampling error are ±5 percentage points.
Between now and the 2004 political conventions, there will be discussion about the qualifications of presidential candidates -- their education, age, religion, race, and so on. If your party nominated a generally well-qualified person for president who happened to be [ITEMS READ], would you vote for that person?
A. Jewish
|
Yes |
No |
No opinion |
|
|
% |
% |
% |
|
|
2003 May 30-Jun 1 |
89 |
8 |
3 |
|
1999 Feb 19-21 |
92 |
6 |
2 |
|
1987 Jul 10-13 |
89 |
6 |
5 |
|
1983 Apr 29-May 2 |
88 |
7 |
5 |
|
1978 Jul 21-24 |
82 |
12 |
6 |
|
1969 Mar 12-17 |
86 |
8 |
6 |
|
1967 Apr 19-24 |
82 |
13 |
5 |
|
1965 Jul 16-21 |
80 |
15 |
5 |
|
1963 Aug 15-20 |
77 |
17 |
6 |
|
1961 Aug 24-29 |
68 |
23 |
9 |
|
1959 Dec 10-15 |
72 |
22 |
6 |
|
1958 Jul 30-Aug 4 |
62 |
28 |
10 |
|
1937 Feb 10-15 |
46 |
47 |
8 |
B. Black
|
Yes |
No |
No opinion |
|
|
% |
% |
% |
|
|
2003 May 30-Jun 1 |
92 |
6 |
2 |
|
1999 Feb 19-21 |
95 |
4 |
1 |
|
1997 Jan 4-Feb 28 |
93 |
4 |
3 |
|
1987 Jul 10-13 |
79 |
13 |
8 |
|
1984 Jul 27-30 |
77 |
16 |
7 |
|
1983 Apr 29-May 2 |
77 |
16 |
7 |
|
1978 Jul 21-24 |
77 |
18 |
5 |
|
1971 Oct 8-11 |
69 |
23 |
7 |
|
1969 Mar 12-17 |
66 |
24 |
10 |
|
1967 Apr 19-24 |
53 |
41 |
6 |
|
1965 Jul 16-21 |
59 |
34 |
7 |
|
1963 Aug 15-20 |
48 |
45 |
7 |
|
1961 Aug 24-29 |
50 |
41 |
9 |
|
1959 Dec 10-15 |
49 |
46 |
5 |
|
1958 Sep 10-15 |
38 |
54 |
8 |
|
1958 Jul 30-Aug 4 |
37 |
53 |
10 |
C. Catholic
|
Yes |
No |
No opinion |
|
|
% |
% |
% |
|
|
2003 May 30-Jun 1 |
93 |
5 |
2 |
|
1999 Feb 19-21 |
94 |
4 |
2 |
|
1983 Apr 29-May 2 |
92 |
5 |
3 |
|
1978 Jul 21-24 |
91 |
4 |
5 |
|
1969 Mar 12-17 |
87 |
7 |
5 |
|
1967 Apr 19-24 |
90 |
8 |
2 |
|
1965 Jul 16-21 |
87 |
10 |
3 |
|
1963 Aug 15-20 |
84 |
13 |
3 |
|
1961 Aug 24-29 |
82 |
13 |
5 |
|
1960 May 26-31 |
71 |
21 |
8 |
|
1959 Dec 10-15 |
70 |
25 |
5 |
|
1959 Apr 2-7 |
70 |
21 |
9 |
|
1958 Sep 10-15 |
67 |
27 |
6 |
|
1958 Jul 30-Aug 4 |
69 |
24 |
7 |
|
1958 Jul 10-15 |
72 |
24 |
4 |
|
1958 May 7-12 |
72 |
21 |
7 |
|
1958 Apr 16-21 |
70 |
22 |
8 |
|
1956 May 31-Jun 5 |
72 |
22 |
5 |
|
1955 Jan 20-25 |
69 |
23 |
8 |
|
1940 Mar 27-Apr 2 |
61 |
33 |
7 |
|
1937 Feb 3-8 |
60 |
30 |
10 |
D. A woman
|
Yes |
No |
No opinion |
|
|
% |
% |
% |
|
|
2003 May 30-Jun 1 |
87 |
12 |
1 |
|
1999 Feb 19-21 |
92 |
7 |
1 |
|
1987 Jul 10-13 |
82 |
12 |
6 |
|
1984 Jul 27-30 |
78 |
17 |
5 |
|
1983 Apr 29-May 2 |
80 |
16 |
4 |
|
1978 Jul 21-24 |
76 |
19 |
5 |
|
1975 Aug 15-18 |
73 |
23 |
4 |
|
1971 Jul 15-18 |
66 |
29 |
5 |
|
1969 Mar 12-17 |
53 |
40 |
7 |
|
1967 Apr 19-24 |
57 |
39 |
4 |
|
1963 Aug 15-20 |
55 |
41 |
4 |
|
1959 Dec 10-15 |
57 |
39 |
4 |
|
1958 Sep 10-15 |
54 |
41 |
5 |
|
1955 Feb 10-15 |
52 |
44 |
4 |
|
1949 Sep 25-30 |
48 |
48 |
4 |
|
1945 Nov 23-28 |
33 |
55 |
12 |
|
1937 Jan 27-Feb 1 |
33 |
64 |
3 |
