GALLUP NEWS SERVICE
PRINCETON, NJ -- Seven of the nine people vying for the Democratic presidential nomination in 2004 met in Chicago this past weekend in an event sponsored by Jesse Jackson's Rainbow/PUSH coalition. The candidates met in front of a largely black and Hispanic audience, and used the occasion to step up their criticism of President George W. Bush's international and domestic policies. A new CNN/USA Today/Gallup poll shows that Connecticut Senator Joe Lieberman continues to be the top choice among Democrats, but black Democrats show the strongest support for the Reverend Al Sharpton. More generally, Americans continue to choose Bush over the Democratic candidate when asked whom they are most likely to vote for in 2004, with blacks showing very low levels of support for Bush.
The poll was conducted June 12-18, prior to the candidates' forum in Chicago, and included increased samples of blacks and Hispanics (with interviewing done in Spanish when necessary) that allow for an in-depth look at these groups. The overall sample is weighted so the proportions of blacks and Hispanics reflect their overall proportions in the U.S. adult population.
Campaign for the Democratic Nomination
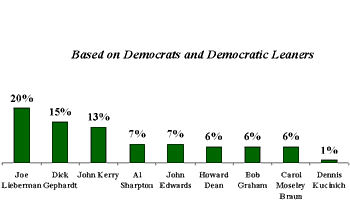
Twenty percent of Democrats in the United States prefer Lieberman for the party's 2004 presidential nomination. Lieberman has a five-point lead over Missouri Congressman Dick Gephardt, large enough to be statistically significant. Massachusetts Senator John Kerry, at 13%, is close behind Gephardt. Lieberman, Gephardt, and Kerry form a top tier of Democratic candidates, as no other candidate reaches double-digit support, on this or the last two Gallup polls. The second tier of candidates is closely bunched, with North Carolina Senator John Edwards and Sharpton at 7% and Florida Senator Bob Graham, former Illinois Senator Carol Moseley Braun, and former Vermont Governor Howard Dean at 6%. Long-shot Ohio Congressman Dennis Kucinich is supported by just 1% of Democrats.
| Democratic Presidential Trial Heat |
 |
| June 12-18, 2003 |
These results have shown little change in three polls conducted since April, with Lieberman, Gephardt, and Kerry -- the best known candidates among those running -- showing a lead over the rest of the field, and Lieberman having a slight edge.
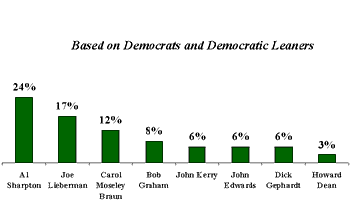
The field is quite different when seen from the point of view of blacks, a key Democratic Party voting bloc. Sharpton, at 24%, has a fairly sizeable edge over Lieberman, at 17%. Moseley Braun is next at 12%. Four other candidates are tightly packed, including Graham (8%), Gephardt, Kerry, and Edwards (all at 6%).
| Democratic Presidential Trial Heat: Among Black Respondents |
 |
| June 12-18, 2003 |
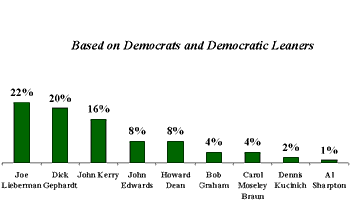
The results among white Democrats generally mirror those for all Democrats -- Lieberman has the most support at 22%, but at 20% Gephardt is essentially tied with him. Kerry, at 16%, is close behind Gephardt, followed by Edwards and Dean, both at 8%. Only 1% of whites support Sharpton, and just 4% support Moseley Braun.
| Democratic Presidential Trial Heat: Among White Respondents |
 |
| June 12-18, 2003 |
Lieberman's relative strength among blacks could be key in a campaign against the other top-tier candidates, Gephardt and Kerry. This advantage could change in time, as Lieberman's standing may well be a reflection of his higher national visibility compared with the other candidates. Also, the level of participation among blacks could greatly affect the competitiveness of the Sharpton and Moseley Braun campaigns, as blacks tend to vote at fairly low rates. Certainly, given his broader appeal, Lieberman's fortunes are less dependent on black participation than are Sharpton's and Moseley Braun's. However, even though it now appears that Sharpton has little chance to win the nomination, his significant support among blacks could make him an important player in the process should he drop out of the race and publicly endorse another candidate.
Looking Toward the General Election
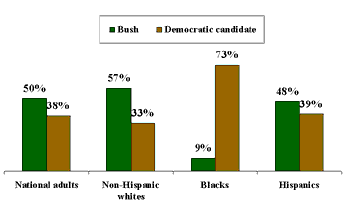
The poll also asked Americans who they are more likely to vote for in 2004 -- George W. Bush or the "Democratic Party's candidate for president." Fifty percent of Americans say Bush, and 38% say the Democratic candidate. (Among registered voters, the figures are 51% and 39%, respectively.) These figures have changed little in recent months, after showing slight movement toward Bush after the start of the Iraq war.
| If George W. Bush runs for re-election in 2004, in general are you more likely to vote for Bush or for the Democratic Party's candidate for president? |
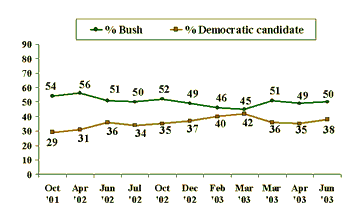 |
An examination of the results by race reveals the strength of blacks as a voting bloc for the Democratic Party. Blacks are eight times more likely to say they will vote for the Democratic candidate in 2004 (73%) than for President Bush (9%). But Bush fares far better among other racial and ethnic groups. Fifty-seven percent of non-Hispanic whites say they are likely to vote for Bush, while 33% say the Democratic candidate. Among Hispanics, an increasingly large voting group coveted by both parties, Bush has an edge of 48% to 39%. However, among the smaller group of Hispanic registered voters, the margin is just 44% to 43% for Bush.
| If George W. Bush runs for re-election in 2004, in general are you more likely to vote for Bush or for the Democratic Party's candidate for president? |
 |
| June 12-18, 2003 |
The data show a gender gap similar to what was observed in the last several presidential elections. Men support Bush by a 54% to 34% margin. Women also support Bush, but by a much smaller margin of 47% to 41%.
While these results give an early read on Bush's re-election chances, it is unclear at this point how predictive they are of the actual outcome of next November's election. Comparable data are available only for the elder George Bush, who stood at 51% support (versus 30% for the Democrat) in June 1991. Bush fell below 50% support in October 1991, and was in the mid-40s in January 1992, 10 months before being defeated for re-election by Bill Clinton.
Survey Methods
Results are based on telephone interviews with 1,385 national adults, aged 18+, conducted June 12-18, 2003, including oversamples of blacks and Hispanics that are weighted to reflect their proportions in the general population. For results based on the total sample of national adults, one can say with 95% confidence that the maximum margin of sampling error is ±3 percentage points.
Results for the sample of 821 non-Hispanic whites, aged 18+, are based on telephone interviews conducted June 12-15, 2003. For results based on the total sample, one can say with 95% confidence that the margin of sampling error is ±4 percentage points.
Results for the sample of 241 blacks, aged 18+, are based on telephone interviews conducted June 12-18, 2003. For results based on the total sample, one can say with 95% confidence that the margin of sampling error is ±7 percentage points.
Results for the sample of 266 Hispanics (including 12 Hispanic respondents who identify their race as black), aged 18+, conducted June 12-18, 2003. For results based on the total sample, one can say with 95% confidence that the margin of sampling error is ±7 percentage points. (Fifty-three out of the 266 interviews with Hispanics were conducted in Spanish).
In addition to sampling error, question wording and practical difficulties in conducting surveys can introduce error or bias into the findings of public opinion polls.
11. If George W. Bush runs for re-election in 2004, in general are you more likely to vote for Bush or for the Democratic Party's candidate for president?
|
|
Democratic candidate |
OTHER |
No |
|
|
% |
% |
% |
% |
|
|
National Adults |
||||
|
2003 Jun 12-18 |
50 |
38 |
3 |
9 |
|
Men |
||||
|
2003 Jun 12-18 |
54 |
34 |
4 |
8 |
|
Women |
||||
|
2003 Jun 12-18 |
47 |
41 |
3 |
9 |
|
Non-Hispanic Whites |
||||
|
2003 Jun 12-15 |
57 |
33 |
3 |
7 |
|
Blacks |
||||
|
2003 Jun 12-18 |
9 |
73 |
4 |
14 |
|
Hispanics |
||||
|
2003 Jun 12-18 |
48 |
39 |
3 |
10 |
|
2002 Oct 3-8 |
49 |
39 |
* |
12 |
REGISTERED VOTERS
|
|
Democratic candidate |
OTHER |
No |
|
|
% |
% |
% |
% |
|
|
National Adults (RV) |
||||
|
2003 Jun 12-18 |
51 |
39 |
3 |
7 |
|
Men (RV) |
||||
|
2003 Jun 12-18 |
54 |
35 |
4 |
7 |
|
Women (RV) |
||||
|
2003 Jun 12-18 |
48 |
43 |
2 |
7 |
|
Non-Hispanic Whites (RV) |
||||
|
2003 Jun 12-15 |
57 |
34 |
3 |
6 |
|
Blacks (RV) |
||||
|
2003 Jun 12-18 |
7 |
78 |
4 |
11 |
|
Hispanics (RV) |
||||
|
2003 Jun 12-18 |
44 |
43 |
4 |
9 |
|
2002 Oct 3-8 |
49 |
43 |
* |
8 |
|
BASED ON 1171 REGISTERED VOTERS; ±3 PCT. PTS. |
||||
|
BASED ON 546 MEN REGISTERED VOTERS; ±5 PCT. PTS. |
||||
|
BASED ON 625 WOMEN REGISTERED VOTERS; ±4 PCT. PTS. |
||||
|
BASED ON 735 NON-HISPANIC WHITE REGISTERED VOTERS; ±4 PCT. PTS. |
||||
|
BASED ON 206 BLACK REGISTERED VOTERS; ±8 PCT. PTS. |
||||
|
BASED ON 189 HISPANIC REGISTERED VOTERS; ±8 PCT. PTS. |
||||
NATIONAL ADULTS AND REGISTERED VOTER TRENDS
|
|
Democratic candidate |
OTHER |
No |
|
|
% |
% |
% |
% |
|
|
George W. Bush |
||||
|
National Adults |
||||
|
(NA) 2003 Jun 12-18 |
50 |
38 |
3 |
9 |
|
(NA) 2003 Apr 22-23 |
49 |
35 |
3 |
13 |
|
(NA) 2003 Mar 29-30 |
51 |
36 |
4 |
9 |
|
(NA) 2003 Mar 14-15 |
45 |
42 |
5 |
8 |
|
(NA) 2003 Feb 24-26 |
46 |
40 |
4 |
10 |
|
(NA) 2002 Dec 16-17 |
49 |
37 |
4 |
10 |
|
(NA) 2002 Oct 3-6 |
52 |
35 |
2 |
11 |
|
(NA) 2002 Jul 29-31 |
50 |
34 |
3 |
13 |
|
(NA) 2002 Jun 21-23 |
51 |
36 |
3 |
10 |
|
(NA) 2002 Apr 29-May 1 |
56 |
31 |
3 |
10 |
|
(NA) 2001 Oct 5-6 |
54 |
29 |
2 |
15 |
|
Registered Voters |
||||
|
(RV) 2003 Jun 12-18 |
51 |
39 |
3 |
7 |
|
(RV) 2003 Apr 22-23 |
49 |
36 |
3 |
12 |
|
(RV) 2003 Mar 29-30 |
51 |
36 |
4 |
9 |
|
(RV) 2003 Mar 14-15 |
45 |
42 |
5 |
8 |
|
(RV) 2003 Feb 24-26 |
47 |
39 |
4 |
10 |
|
(RV) 2002 Dec 16-17 |
51 |
37 |
3 |
9 |
|
(RV) 2002 Oct 3-6 |
54 |
35 |
1 |
10 |
|
(RV) 2002 Jul 29-31 |
51 |
34 |
3 |
12 |
|
(RV) 2002 Jun 21-23 |
51 |
37 |
3 |
9 |
|
(RV) 2002 Apr 29-May 1 |
56 |
32 |
3 |
9 |
|
(RV) 2001 Oct 5-6 |
56 |
29 |
2 |
13 |
|
George H.W. Bush |
||||
|
(NA) 1992 Jan 31-Feb 2 |
46 |
38 |
-- |
16 |
|
(NA) 1992 Jan 3-9 |
42 |
41 |
-- |
17 |
|
(NA) 1991 Dec 5-8 |
48 |
34 |
-- |
18 |
|
(NA) 1991 Nov 21-24 |
48 |
36 |
-- |
16 |
|
(NA) 1991 Oct 31-Nov 3 |
46 |
36 |
-- |
18 |
|
(NA) 1991 Oct 10-13 |
49 |
32 |
-- |
19 |
|
(NA) 1991 Sep 13-15 |
51 |
29 |
-- |
20 |
|
(NA) 1991 Sep 5-8 |
52 |
29 |
-- |
19 |
|
(NA) 1991 Aug 23-25 |
55 |
27 |
-- |
18 |
|
(NA) 1991 Jun 13-16 |
51 |
30 |
-- |
19 |
|
(NA) 1991 Apr 25-28 |
51 |
30 |
-- |
19 |
|
(NA) 1991 Mar 7-10 |
67 |
17 |
-- |
16 |
|
(NA) 1991 Feb 14-17 |
54 |
33 |
-- |
13 |
|
1991-1992 WORDING: If George Bush runs for re-election in 1992, in general are you more likely to vote for Bush or for the Democratic Party's candidate for president? |
||||
48. Next, I'm going to read a list of people who may be running in the Democratic primary for president in the next election. After I read all the names, please tell me which of those candidates you would be most likely to support for the Democratic nomination for President in the year 2004. [ROTATED:Massachusetts Senator, John Kerry, Connecticut Senator, Joe Lieberman, North Carolina Senator, John Edwards, Missouri Congressman, Dick Gephardt, Florida Senator, Bob Graham, Vermont Governor, Howard Dean, the Reverend Al Sharpton, Ohio Congressman, Dennis Kucinich, Former Illinois Senator, Carol Moseley Braun].
BASED ON 697 DEMOCRATS OR DEMOCRATIC LEANERS
BASED ON 603 DEMOCRATS OR DEMOCRATIC LEANERS WHO ARE REGISTERED
TO VOTE
|
2003 Jun 12-18 |
2003 May 30-June 1 |
2003 Apr 22-23 |
||||
|
National |
Registered Voters |
National |
Registered Voters |
National |
Registered Voters |
|
|
% |
% |
% |
% |
% |
% |
|
|
Joe Lieberman |
20 |
21 |
21 |
20 |
23 |
22 |
|
Dick Gephardt |
15 |
17 |
14 |
14 |
15 |
16 |
|
John Kerry |
13 |
13 |
16 |
17 |
17 |
18 |
|
John Edwards |
7 |
6 |
7 |
6 |
9 |
8 |
|
Al Sharpton |
7 |
6 |
7 |
7 |
3 |
3 |
|
Bob Graham |
6 |
7 |
4 |
4 |
5 |
5 |
|
Carol Moseley Braun |
6 |
5 |
3 |
4 |
4 |
4 |
|
Howard Dean |
6 |
7 |
5 |
5 |
6 |
6 |
|
Dennis Kucinich |
1 |
1 |
3 |
2 |
3 |
3 |
|
Other |
1 |
1 |
1 |
1 |
1 |
1 |
|
No one |
5 |
5 |
4 |
5 |
5 |
5 |
|
No opinion |
13 |
11 |
15 |
15 |
9 |
9 |
|
|
|
Dems. |
|
Non-Hispanic White |
|
|
|
% |
% |
% |
% |
% |
% |
|
|
Joe Lieberman |
20 |
19 |
21 |
22 |
17 |
16 |
|
Dick Gephardt |
15 |
15 |
15 |
20 |
6 |
9 |
|
John Kerry |
13 |
15 |
11 |
16 |
6 |
8 |
|
John Edwards |
7 |
9 |
5 |
8 |
6 |
5 |
|
Al Sharpton |
7 |
7 |
6 |
1 |
24 |
8 |
|
Bob Graham |
6 |
7 |
6 |
4 |
8 |
13 |
|
Carol Moseley Braun |
6 |
2 |
9 |
4 |
12 |
4 |
|
Howard Dean |
6 |
8 |
4 |
8 |
3 |
3 |
|
Dennis Kucinich |
1 |
2 |
1 |
2 |
-- |
1 |
|
Other |
1 |
1 |
1 |
1 |
-- |
3 |
|
No one |
5 |
7 |
4 |
5 |
3 |
9 |
|
No opinion |
13 |
8 |
17 |
9 |
15 |
21 |
|
BASED ON 697 DEMOCRATS; ±4 PCT. PTS. |
||||||
|
BASED ON 317 MEN DEMOCRATS; ±6 PCT. PTS. |
||||||
|
BASED ON 380 WOMEN DEMOCRATS; ±5 PCT. PTS. |
||||||
|
BASED ON 341 NON-HISPANIC WHITE DEMOCRATS; ±6 PCT. PTS. |
||||||
|
BASED ON 192 BLACK DEMOCRATS; ±8 PCT. PTS. |
||||||
|
BASED ON 142 HISPANIC DEMOCRATS; ±9 PCT. PTS. |
||||||
|
|
|
Dems. (RVs) |
|
Non-Hispanic White |
|
|
|
% |
% |
% |
% |
% |
% |
|
|
Joe Lieberman |
21 |
21 |
21 |
23 |
16 |
20 |
|
Dick Gephardt |
17 |
17 |
17 |
21 |
7 |
9 |
|
John Kerry |
13 |
13 |
12 |
15 |
6 |
10 |
|
Bob Graham |
7 |
7 |
6 |
5 |
9 |
13 |
|
Howard Dean |
7 |
10 |
4 |
8 |
3 |
4 |
|
Al Sharpton |
6 |
7 |
6 |
1 |
24 |
5 |
|
John Edwards |
6 |
8 |
4 |
7 |
3 |
4 |
|
Carol Moseley Braun |
5 |
2 |
8 |
3 |
14 |
1 |
|
Dennis Kucinich |
1 |
2 |
1 |
2 |
-- |
1 |
|
Other |
1 |
1 |
1 |
1 |
-- |
3 |
|
No One |
5 |
6 |
4 |
5 |
3 |
12 |
|
No Opinion |
11 |
6 |
16 |
9 |
15 |
18 |
|
BASED ON 603 DEMOCRATS WHO ARE REGISTERED TO VOTE; ±4 PCT. PTS. |
||||||
|
BASED ON 267 MEN DEMOCRATS WHO ARE REGISTERED TO VOTE; ±7 PCT. PTS. |
||||||
|
BASED ON 336 WOMEN DEMOCRATS WHO ARE REGISTERED TO VOTE; ±6 PCT. PTS. |
||||||
|
BASED ON 311 NON-HISPANIC WHITE DEMOCRATS WHO ARE REGISTERED TO VOTE; ±6 PCT. PTS. |
||||||
|
BASED ON 170 BLACK DEMOCRATS WHO ARE REGISTERED TO VOTE; ±8 PCT. PTS. |
||||||
|
BASED ON 107 HISPANIC DEMOCRATS WHO ARE REGISTERED TO VOTE; ±10 PCT. PTS. |
||||||
(RV) – Registered voters
(NA) – National adults
* -- less than 0.5%
