GALLUP NEWS SERVICE
PRINCETON, NJ -- Labor Day was created by the nation's labor movement over 100 years ago, and was quickly formalized by most states as an official holiday. That momentum is a distant memory today as only 14% of working Americans tell Gallup that they personally belong to a labor union, and just 18% of all Americans report living in a household where at least one person belongs to a union. These figures are down sharply from the middle of the 20th century. Even as recently as 1983, 20% of U.S. workers belonged to unions.
Yet despite labor's small membership base today, most Americans approve of labor unions and believe that unions are generally helpful to workers who are union members, helpful to companies where workers are organized, and helpful to the economy. Only when it comes to the interests of non-unionized workers do Americans tend to believe unions are harmful.
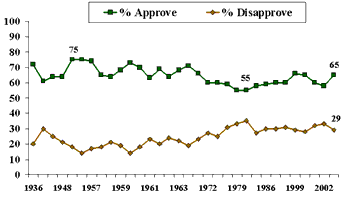
Public reaction to labor unions is one of the longest running trends maintained by The Gallup Poll. The question "Do you approve or disapprove of labor unions?" was first asked in 1936, a year after Congress passed the Wagner Act establishing the right of most private-sector employees to join unions, to bargain collectively with their employers, and to strike. That first poll found 72% of Americans approving of unions and only 20% disapproving.
Broad support has been maintained ever since, although to varying degrees. Approval of unions was greatest in the 1950s (coincident with the peak of union membership in the United States) when the approval figure reached 75%. The low point was 55%, recorded in the late 1970s and early 1980s. Today, perceptions of labor unions are about average compared to Gallup's historic trends, with 65% of Americans saying they approve and 29% saying they disapprove.
| Do You Approve or Disapprove of Labor Unions? |
 |
There is some variation in public support for unions, particularly based on political orientation. Three in four Democrats, but only 50% of Republicans, say they approve of labor unions. Young adults (aged 18-29) are the most supportive age category, with 77% approving, while seniors (65 and older) are the least supportive (60% approve). Middle-aged Americans are closer to seniors in their views (64% approve).
Unions Do More Good Than Harm in Most Areas
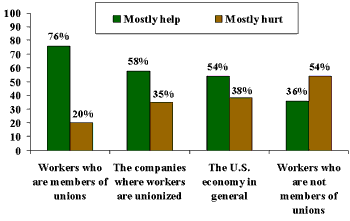
Americans widely perceive labor unions as beneficial to union workers. Three in four Americans believe unions mostly help these workers, while 20% think they mostly hurt them. Majorities of Americans also believe unions are mostly helpful to the companies where workers are unionized (58%) and to the U.S. economy in general (54%). However, only 36% believe unions mostly help workers who are not unionized; the majority (54%) says unions mostly hurt these workers.
| Impact of Labor Unions on Various Entities |
 |
| Aug. 4-6, 2003 |
Naturally, union workers are more positive than non-unionized Americans about all of these dimensions, but this gap is particularly wide with respect to unions' impact on the nation's economy and on unionized companies. More than 8 in 10 union workers perceive these two entities as mostly benefiting from labor unions, compared to just over half of non-union workers.
|
Perceptions of Unions' Impact According to Union Status
|
|||
|
Union Employee |
Non-Unionized Americans |
Gap |
|
|
% saying unions help: |
% |
% |
|
|
Unionized companies |
86 |
56 |
30 pts. |
|
The U.S. economy |
80 |
51 |
29 pts. |
|
Union workers |
92 |
75 |
17 pts. |
|
Non-union workers |
54 |
35 |
19 pts. |
Who Belongs?
Approximately one in seven working adults in the United States (14%) belong to a labor union, which works out to 10% of all Americans.
Among various sectors of the job market, union membership is highest today among government employees. In fact, close to one in three government workers tell Gallup they belong to a union, compared with only 10% of those working for a private business. Those working in nonprofit organizations have an average union membership of 15%.
As a result of this skew in the prevalence of unionization, the distribution of union members across the various employer sectors looks quite different from the overall pattern of employment. For example, whereas more than half of all workers in the United States are employed by a private firm (58%), only 39% of unionized workers work for a private business. Similarly, 17% of all workers, but 40% of unionized workers, are employed by government.
|
Type of Employer Among All Workers vs. Among Union Members
|
||
|
All Workers |
Union members |
|
|
Private company or business |
58% |
39% |
|
Nonprofit organization |
10 |
11 |
|
Government |
17 |
40 |
|
Self-employed |
13 |
5 |
|
Other |
1 |
1 |
|
No answer |
1 |
4 |
|
100% |
100% |
|
Survey Methods
These results are based on telephone interviews with a randomly selected national sample of 1,003 adults, 18 years and older, conducted Aug. 4-6, 2003. For results based on this sample, one can say with 95 percent confidence that the maximum error attributable to sampling and other random effects is ±3 percentage points. In addition to sampling error, question wording and practical difficulties in conducting surveys can introduce error or bias into the findings of public opinion polls.
19. Do you approve or disapprove of labor unions?
|
|
Dis-approve |
No |
|
|
2003 Aug 4-6 |
65 |
29 |
6 |
|
2002 Aug 5-8 |
58 |
33 |
9 |
|
2001 Aug 16-19 |
60 |
32 |
8 |
|
1999 Aug 24-26 |
65 |
28 |
7 |
|
1999 Mar 5-7 |
66 |
29 |
5 |
|
1997 Aug 12-13 |
60 |
31 |
9 |
|
1991 Jul 18-21 |
60 |
30 |
10 |
|
1986 Jul 11-14 |
59 |
30 |
11 |
|
1985 Apr 12-15 |
58 |
27 |
15 |
|
1981 Aug 14-17 |
55 |
35 |
11 |
|
1979 May 4-7 |
55 |
33 |
12 |
|
1978 Jan 6-9 |
59 |
31 |
10 |
|
1972 Dec 8-11 |
60 |
25 |
15 |
|
1972 Mar 24-27 |
60 |
27 |
13 |
|
1967 Sep 14-19 |
66 |
23 |
11 |
|
1965 May 13-18 |
71 |
19 |
11 |
|
1963 Jan 11-16 |
68 |
22 |
10 |
|
1962 Jun 28-Jul 3 |
64 |
24 |
11 |
|
1961 Sep 21-26 |
69 |
20 |
11 |
|
1961 May 4-9 |
63 |
23 |
14 |
|
1961 Jan 12-17 |
70 |
18 |
12 |
|
1959 Aug 20-25 |
73 |
14 |
12 |
|
1959 Jan 7-12 |
68 |
19 |
13 |
|
1958 Oct 15-20 |
64 |
21 |
15 |
|
1957 Aug 29-Sep 4 |
65 |
18 |
17 |
|
1957 Apr 6-11 |
74 |
17 |
9 |
|
1957 Jan 17-22 |
75 |
14 |
11 |
|
1953 Oct 9-14 |
75 |
18 |
7 |
|
1948 Dec 10-15 |
64 |
21 |
15 |
|
1947 Jul 4-9 |
64 |
25 |
11 |
|
1941 |
61 |
30 |
9 |
|
1936 |
72 |
20 |
8 |
D18. Is anyone living in your household a member of a labor union?
D18a. Are you a member of a labor union, or does some other member of your household belong to a labor union?
COMBINED RESPONSES (D18-D18a)
|
2003 Aug 4-6 |
|
|
% |
|
|
Yes, member of household in a labor union |
18 |
|
Respondent in labor union |
(9) |
|
Both respondent and other household member in labor union |
(1) |
|
Other member of household in labor union |
(8) |
|
No, no member of household in a labor union |
82 |
|
No opinion |
* |
|
* Less than 0.5% |
20. Overall, do you think labor unions mostly help or mostly hurt [INSERT ITEM, RANDOM ORDER]? How about -- [INSERT NEXT ITEM]?
A. Workers who are members of unions
|
Mostly help |
Mostly hurt |
No opinion |
|
|
% |
% |
% |
|
|
2003 Aug 4-6 |
76 |
20 |
4 |
|
2001 Aug 16-19 |
74 |
20 |
6 |
|
1999 Mar 5-7 |
72 |
24 |
4 |
B. The U.S. economy in general
|
Mostly help |
Mostly hurt |
No opinion |
|
|
% |
% |
% |
|
|
2003 Aug 4-6 |
54 |
38 |
8 |
|
2001 Aug 16-19 |
49 |
38 |
13 |
|
1999 Mar 5-7 |
55 |
37 |
8 |
|
1997 Aug 22-25 ^ |
48 |
45 |
7 |
|
^ WORDING: The economy |
|||
C. Workers who are not members of unions
|
Mostly help |
Mostly hurt |
No opinion |
|
|
% |
% |
% |
|
|
2003 Aug 4-6 |
36 |
54 |
10 |
|
2001 Aug 16-19 |
36 |
50 |
14 |
|
1999 Mar 5-7 |
35 |
55 |
10 |
D. The companies where workers are unionized
|
Mostly help |
Mostly hurt |
No opinion |
|
|
% |
% |
% |
|
|
2003 Aug 4-6 |
58 |
35 |
7 |
|
2001 Aug 16-19 |
52 |
38 |
10 |
