GALLUP NEWS SERVICE
PRINCETON, NJ -- The election for president is little more than a year away, and if the election were held today, the most recent CNN/USA Today/Gallup poll suggests President George W. Bush would be re-elected in a close race. That poll shows 53% of registered voters saying Bush deserves re-election. However, as many registered voters currently say they will definitely not vote for Bush (38%) as say they will definitely vote for him (38%). On the Democratic side, retired Gen. Wesley Clark continues to lead the field for that party's nomination in a rather tightly contested race. Gallup data from the past month show that the Rev. Al Sharpton continues to be the top choice among black Democrats. Generally speaking, more Americans say they are pleased with the field of candidates running for president in 2004 than say they wish others would join the race.
Bush Re-Election Prospects
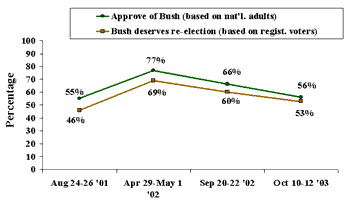
The poll, conducted Oct. 10-12, finds 53% of registered voters saying President Bush deserves to be re-elected, while 45% say he does not. In the same poll, Bush's job approval rating is 56%. By contrast, last year, when more than 60% of Americans approved of the job Bush was doing as president, at least 6 in 10 registered voters said Bush deserved another term. So as Bush's approval ratings have declined, his re-election prospects have become more tenuous.
| Bush Approval Ratings Versus Whether He Deserves to Be Re-Elected |
 |
When asked specifically about their voting intentions, registered voters are evenly divided as to whether they will definitely vote for Bush (38%) or definitely vote against him (38%). Twenty-four percent say they might vote for or against the president.
As the data make clear, there is not a one-to-one relationship between saying Bush deserves re-election and being committed to voting for him. This could reflect caution on the part of voters, realizing a lot can change between now and next Election Day, and also wanting to get a sense of who his challenger will be and on what issues the election will be fought.
A closer look at the group of those who have not committed to voting for or against Bush reveals that they are more inclined to support Bush than not.
- Seventy-three percent of those who may vote either for or against Bush approve of the way he is handling his job as president, while only 20% disapprove.
- Sixty-six percent of this undecided group says Bush deserves re-election while 27% say he does not.
- This group tends to be slightly more Republican than Democratic. Forty-nine percent are Republicans or lean to the Republican Party and 41% are Democrats or lean to the Democratic Party.
While these questions give an indication of what would happen if the election were held today, they are not necessarily predictive of what will happen next November. However, as the election approaches, questions like these are a better barometer of what will actually happen. For example, a Gallup Poll of Oct. 31-Nov. 3, 1991 showed 56% of registered voters saying the elder George Bush deserved to be re-elected. But by February 1992, more registered voters said he did not deserve re-election than said he did, and by July a majority said Bush should not get another term in office, leading up to his election defeat in November 1992. In January 1996, only 45% said Bill Clinton deserved to be re-elected, but by March of that year, the percentage had climbed to 51% as he went on to win a second term.
The Democratic Side
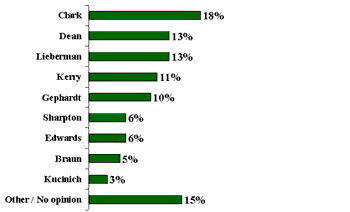
The poll also asked Democrats (including independents who lean to the Democratic Party) about their preferences for the Democratic Party's presidential nomination in 2004. The results are consistent with what Gallup has been finding for the past month, with Clark holding a slim lead over the eight other candidates. With 18% support among Democrats registered to vote, Clark leads a second tier of candidates, which includes Howard Dean (13%), Joe Lieberman (13%), John Kerry (11%), and Dick Gephardt (10%). A third tier of candidates includes Al Sharpton (6%), John Edwards (6%), Carol Moseley Braun (5%), and Dennis Kucinich (3%).
| Support for Each Candidate Among Democrats Registered to Vote |
 |
| Oct 10-12, 2003 |
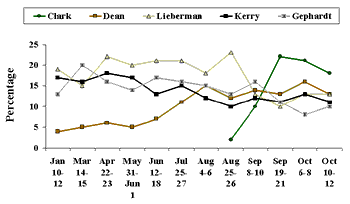
Clark has led the Democratic field in Gallup Polls ever since he formally announced his candidacy in mid-September. Dean's support began to increase in the early summer months and he has been in double digits since July. Dean's and Clark's ascensions have come at the expense of Lieberman, Kerry, and Gephardt. This latter group of candidates have all served in Congress and are nationally recognized political figures. Their earlier standing could thus be attributed to their greater name recognition rather than any particular appeal of their campaigns. Support for these three had been in at least the mid-to-high teens (Lieberman's support often exceeded 20%) in the earlier part of this year, but now their support levels have settled into the 10% to 13% range.
| Support for Democratic Presidential
Nomination 2003 Gallup Polls |
 |
One key Democratic constituency -- blacks -- shows very different preferences for the nomination. A combined sample of black Democrats from the last three Gallup Polls show Sharpton as the leading candidate among blacks. Twenty-two percent of blacks say they support Sharpton for the nomination, giving him a nine-point edge over Clark and 10 points over Lieberman. No other candidate gets double-digit support among black Democrats, and about one in five do not express a preference.
Support for the Democratic Nomination Among Black Democrats, Sept.-Oct. 2003
|
Candidate |
Percentage supporting |
|
Sharpton |
22% |
|
Clark |
13% |
|
Lieberman |
12% |
|
Dean |
8% |
|
Moseley Braun |
7% |
|
Gephardt |
6% |
|
Kerry |
5% |
|
Edwards |
5% |
|
Kucinich |
1% |
|
Other/None/No opinion |
21% |
A Gallup Poll from June also showed Sharpton as the top choice of black Democrats, at 24%. Lieberman was second, at 17%, and Moseley Braun third, at 12%, with all other candidates in single digits.
Among white Democrats, today's figures generally mirror those among all Democrats, with Clark (22%), Dean (15%), Kerry (13%), Lieberman (12%), and Gephardt (10%) the leading candidates. Only 1% of white Democrats currently support Sharpton's candidacy.
The Field of Candidates
More Americans say they are generally pleased with the field of candidates running for president (52%) than express a desire for someone else to run (39%). Not surprisingly, Republicans are most likely to say they are pleased with the candidates (62%), Democrats are slightly less likely to do so (51%), and independents are the least likely (45%). This is probably due to Republicans' favorable views of the president, who is not being challenged for the Republican presidential nomination.
With actor Arnold Schwarzenegger's recent victory in the California recall election, and retired Gen. Clark's strong early showing for the Democratic nomination, some might wonder whether Americans are being drawn to candidates without previous electoral experience. However, the poll shows that by a 64% to 26% margin, Americans would prefer to vote for a candidate who has previously held elected office rather than for one who has never held office.
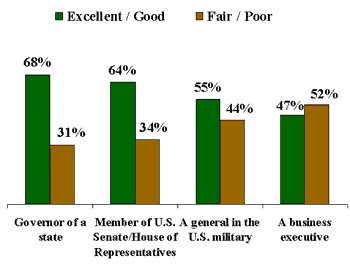
This finding is echoed in public perceptions about the ability of various occupations to prepare someone for the job of president. Americans tend to see being a state governor or a member of Congress as giving someone the strongest background. Sixty-eight percent say being governor is good preparation for being president, including 17% who say it is excellent preparation. Sixty-four percent believe that serving as a member of the U.S. House of Representatives, or in the U.S. Senate, is good preparation (14% say excellent). Fewer Americans, but still a majority (55%), believe serving as a general in the U.S. military prepares someone well to be president. Less than half of the public, 47%, says this about being a business executive.
| What Kind of Preparation Do These Occupations Give a Person in Being an Effective President? |
 |
| Oct 10-12, 2003 |
For the most part, Democrats' perceptions about professional experience are not strongly related to their choices for the Democratic nomination. However, Clark's support is more than twice as high among Democrats who think serving as a military general is excellent or good preparation for being president (26%) than among those who think it is only fair or poor preparation (10%). Dean (18%) and Kerry (14%) fare much better among Democrats who question the value of being a military general as good training for being president.
Survey Methods
These results are based on telephone interviews with a randomly selected national sample of 1,004 adults, 18 years and older, conducted Oct. 10-12, 2003. For results based on this sample, one can say with 95% confidence that the maximum error attributable to sampling and other random effects is ±3 percentage points.
The results for black Democrats are based on 205 interviews conducted in polls Sept. 19-21, Oct. 6-8, and Oct 10-12, 2003. For results based on this sample, one can say with 95% confidence that the maximum error attributable to sampling and other random effects is ±8 percentage points.
The results for white Democrats are based on 1,075 interviews conducted in polls Sept. 19-21, Oct. 6-8, and Oct 10-12, 2003. For results based on this sample, one can say with 95% confidence that the maximum error attributable to sampling and other random effects is ±3 percentage points.
In addition to sampling error, question wording and practical difficulties in conducting surveys can introduce error or bias into the findings of public opinion polls.
2. Please tell me whether you think each of the following political office-holders deserves to be reelected, or not. How about -- [ITEM A READ FIRST, THEN ITEMS B-C ROTATED]?
A. President Bush
|
Yes, deserves |
No, does not |
No opinion |
|
|
% |
% |
% |
|
|
National Adults |
|||
|
2003 Oct 10-12 |
52 |
45 |
3 |
|
2002 Sep 20-22 |
62 |
33 |
5 |
|
2002 Apr 29-May 1 |
70 |
25 |
5 |
|
2001 Aug 24-26 |
46 |
44 |
10 |
|
Registered Voters |
|||
|
2003 Oct 10-12 |
53 |
45 |
2 |
|
2002 Sep 20-22 |
60 |
35 |
5 |
|
2002 Apr 29-May 1 |
69 |
25 |
6 |
|
2001 Aug 24-26 |
46 |
44 |
10 |
B. The U.S. Representative in your Congressional District
|
Yes, deserves |
No, does not |
No opinion |
|
|
% |
% |
% |
|
|
National Adults |
|||
|
2003 Oct 10-12 |
64 |
22 |
14 |
|
2002 Sep 20-22 |
64 |
19 |
17 |
|
2002 Apr 29-May 1 |
66 |
18 |
16 |
|
2001 Aug 24-26 |
64 |
20 |
16 |
|
2000 Jan 7-10 |
67 |
15 |
18 |
|
1998 Oct 9-12 |
68 |
16 |
16 |
|
1998 Apr 17-19 |
64 |
19 |
17 |
|
1997 Oct 27-29 |
62 |
18 |
20 |
|
1997 Aug 22-25 |
63 |
21 |
16 |
|
1996 May 9-12 |
65 |
22 |
13 |
|
1996 Jan 12-15 |
62 |
21 |
17 |
|
1994 Nov 2-6 |
53 |
29 |
18 |
|
1994 Oct 22-25 |
54 |
30 |
16 |
|
1994 Oct 18-19 |
57 |
29 |
14 |
|
1994 Oct 7-9 |
54 |
29 |
17 |
|
1994 Jul 15-17 |
60 |
27 |
13 |
|
1994 Mar 25-27 |
60 |
23 |
17 |
|
1994 Feb 26-28 |
59 |
28 |
13 |
|
1993 Dec 17-19 |
59 |
26 |
15 |
|
1993 Nov 2-4 |
62 |
19 |
19 |
|
1993 Jul 19-21 |
58 |
25 |
17 |
|
1991 Nov |
58 |
25 |
17 |
|
Registered Voters |
|||
|
2003 Oct 10-12 |
65 |
24 |
11 |
|
2002 Sep 20-22 |
67 |
19 |
14 |
|
2002 Apr 29-May 1 |
67 |
19 |
14 |
|
2001 Aug 24-26 |
67 |
20 |
13 |
|
2000 Sep 11-13 |
66 |
19 |
15 |
|
2000 Jan 7-10 |
70 |
16 |
14 |
|
1998 Oct 9-12 |
69 |
17 |
14 |
|
1998 Apr 17-19 |
65 |
21 |
14 |
|
1994 Nov 2-6 |
54 |
30 |
16 |
|
1994 Oct 22-25 |
55 |
32 |
13 |
|
1994 Oct 7-9 |
55 |
30 |
15 |
|
1994 Jul 15-17 |
61 |
28 |
11 |
|
1994 Mar 25-27 |
60 |
23 |
17 |
|
1994 Feb 26-28 |
59 |
28 |
13 |
|
1992 Oct 23-25 |
48 |
30 |
22 |
|
1992 Sep 11-15 |
54 |
25 |
21 |
|
1992 Jul 31-Aug 2 |
61 |
25 |
14 |
|
1992 Apr 20-22 |
50 |
31 |
19 |
|
1992 Apr 9-12 |
58 |
29 |
13 |
|
1992 Mar 20-22 |
56 |
30 |
14 |
|
1992 Jan 31-Feb 2 |
64 |
24 |
12 |
|
1992 Jan 3-9 |
61 |
25 |
14 |
C. Most members of the U.S. House of Representatives
|
Yes, deserves |
No, does not |
No opinion |
|
|
% |
% |
% |
|
|
National Adults |
|||
|
2003 Oct 10-12 |
51 |
35 |
14 |
|
2002 Sep 20-22 |
57 |
28 |
15 |
|
2002 Apr 29-May 1 |
58 |
22 |
20 |
|
2001 Aug 24-26 |
51 |
31 |
18 |
|
2000 Jan 7-10 |
55 |
31 |
14 |
|
1998 Oct 9-12 |
58 |
26 |
16 |
|
1998 Apr 17-19 |
56 |
28 |
16 |
|
1997 Oct 27-29 |
50 |
29 |
21 |
|
1997 Aug 22-25 |
56 |
27 |
17 |
|
1996 May 9-12 |
50 |
35 |
15 |
|
1996 Jan 12-15 |
47 |
38 |
15 |
|
1994 Nov 2-6 |
39 |
45 |
16 |
|
1994 Oct 22-25 |
43 |
44 |
13 |
|
1994 Oct 18-19 |
44 |
42 |
14 |
|
1994 Oct 7-9 |
37 |
48 |
15 |
|
1994 Jul 15-17 |
41 |
43 |
16 |
|
1994 Mar 25-27 |
46 |
38 |
16 |
|
1994 Feb 26-28 |
42 |
44 |
14 |
|
1993 Dec 17-19 |
38 |
47 |
15 |
|
1993 Jul 19-21 |
39 |
46 |
15 |
|
1991 Nov |
38 |
48 |
14 |
|
Registered Voters |
|||
|
2003 Oct 10-12 |
50 |
37 |
13 |
|
2002 Sep 20-22 |
57 |
29 |
14 |
|
2002 Apr 29-May 1 |
57 |
24 |
19 |
|
2001 Aug 24-26 |
52 |
30 |
18 |
|
2000 Sep 11-13 |
54 |
30 |
16 |
|
2000 Jan 7-10 |
56 |
31 |
13 |
|
1998 Oct 9-12 |
58 |
27 |
15 |
|
1998 Apr 17-19 |
55 |
29 |
16 |
|
1994 Nov 2-6 |
38 |
47 |
15 |
|
1994 Oct 22-25 |
43 |
45 |
12 |
|
1994 Oct 7-9 |
37 |
49 |
14 |
|
1994 Jul 15-17 |
40 |
46 |
14 |
|
1994 Mar 25-27 |
46 |
38 |
16 |
|
1994 Feb 26-28 |
42 |
44 |
14 |
|
1992 Oct 23-25 |
29 |
50 |
21 |
|
1992 Sep 11-15 |
32 |
46 |
22 |
|
1992 Jul 31 Aug 2 |
40 |
46 |
14 |
|
1992 Apr 20-22 |
33 |
50 |
17 |
|
1992 Apr 9-12 |
32 |
53 |
15 |
|
1992 Mar 20-22 |
31 |
58 |
11 |
|
1992 Jan 31-Feb 2 |
43 |
43 |
14 |
|
1992 Jan 3-9 |
43 |
42 |
15 |
3. If George W. Bush runs for re-election in 2004, would you say you will -- [ROTATED: definitely vote for him, might vote for or against him, or will you definitely vote against him]?
|
|
Might vote for or against |
|
|
|
|
|
National Adults |
% |
% |
% |
% |
% |
|
2003 Oct 10-12 |
35 |
25 |
38 |
1 |
1 |
|
2003 Jan 10-12 |
34 |
32 |
32 |
1 |
1 |
|
Registered Voters |
|||||
|
2003 Oct 10-12 |
38 |
24 |
38 |
* |
* |
|
2003 Jan 10-12 |
36 |
31 |
32 |
* |
1 |
|
(vol.) Volunteered response |
|||||
|
* Less than 0.5% |
|||||
6. Next, I'm going to read a list of people who may be running in the Democratic primary for president in the next election. After I read all the names, please tell me which of those candidates you would be most likely to support for the Democratic nomination for President in the year 2004. [ROTATED: Massachusetts Senator, John Kerry, Connecticut Senator, Joe Lieberman, North Carolina Senator, John Edwards, Missouri Congressman, Dick Gephardt, Former Vermont Governor, Howard Dean, the Reverend Al Sharpton, Ohio Congressman, Dennis Kucinich, Former Illinois Senator, Carol Moseley Braun, Retired General, Wesley Clark]
BASED ON -- 456 -- DEMOCRATS OR DEMOCRATIC LEANERS
BASED ON -- 388 -- DEMOCRATS OR DEMOCRATIC LEANERS WHO ARE REGISTERED TO VOTE
|
|
|
|
|
|
|
|
|
|
|
None/ |
||
|
% |
% |
% |
% |
% |
% |
% |
% |
% |
% |
% |
||
|
All Democrats/Democratic Leaners |
||||||||||||
|
2003 Oct 10-12 |
19 |
13 |
12 |
10 |
9 |
7 |
5 |
5 |
3 |
-- |
17 |
|
|
2003 Oct 6-8 ^ |
20 |
15 |
13 |
12 |
8 |
5 |
4 |
3 |
2 |
-- |
18 |
|
|
2003 Sep 19-21 |
21 |
12 |
11 |
12 |
9 |
5 |
3 |
4 |
2 |
4 |
17 |
|
|
2003 Sep 8-10 |
9 |
13 |
12 |
11 |
15 |
3 |
5 |
5 |
2 |
5 |
20 |
|
|
2003 Aug 25-26 |
2 |
11 |
23 |
9 |
13 |
4 |
4 |
5 |
1 |
6 |
22 |
|
|
2003 Aug 4-6 |
-- |
14 |
17 |
12 |
14 |
4 |
5 |
6 |
2 |
5 |
21 |
|
|
2003 Jul 25-27 |
-- |
10 |
20 |
16 |
14 |
5 |
6 |
6 |
2 |
5 |
16 |
|
|
2003 Jun 12-18 |
-- |
6 |
20 |
13 |
15 |
7 |
6 |
7 |
1 |
6 |
19 |
|
|
2003 May 31-Jun 1 |
-- |
5 |
21 |
16 |
14 |
7 |
3 |
7 |
3 |
4 |
20 |
|
|
2003 Apr 22-23 |
-- |
6 |
23 |
17 |
15 |
3 |
4 |
9 |
3 |
5 |
15 |
|
|
Democrats/Democratic Leaners who are Registered to Vote |
||||||||||||
|
2003 Oct 10-12 |
18 |
13 |
13 |
11 |
10 |
6 |
5 |
6 |
3 |
-- |
15 |
|
|
2003 Oct 6-8 ^ |
21 |
16 |
13 |
13 |
8 |
6 |
4 |
2 |
2 |
-- |
15 |
|
|
2003 Sep 19-21 |
22 |
13 |
10 |
11 |
11 |
4 |
3 |
4 |
2 |
4 |
16 |
|
|
2003 Sep 8-10 |
10 |
14 |
13 |
12 |
16 |
2 |
4 |
5 |
2 |
5 |
17 |
|
|
2003 Aug 25-26 |
2 |
12 |
23 |
10 |
13 |
4 |
5 |
5 |
1 |
4 |
21 |
|
|
2003 Aug 4-6 |
-- |
15 |
18 |
12 |
15 |
4 |
5 |
5 |
2 |
5 |
19 |
|
|
2003 Jul 25-27 |
-- |
11 |
21 |
15 |
16 |
5 |
6 |
6 |
2 |
4 |
14 |
|
|
2003 Jun 12-18 |
-- |
7 |
21 |
13 |
17 |
6 |
5 |
6 |
1 |
7 |
17 |
|
|
2003 May 31-Jun 1 |
-- |
5 |
20 |
17 |
14 |
7 |
4 |
6 |
2 |
4 |
21 |
|
|
2003 Apr 22-23 |
-- |
6 |
22 |
18 |
16 |
3 |
4 |
8 |
3 |
5 |
15 |
|
|
^ |
NOTE: Bob Graham dropped out of race on Oct. 6, his name was removed from question for Oct. 7-8 interviewing; Graham response from Oct. 6 included in "other" category. |
|||||||||||
Next, thinking about candidates for president,
13. Are you generally pleased with the field of the candidates running for president, or do you wish someone else was running for president?
|
Generally |
Wish someone |
No |
|
|
2003 Oct 10-12 |
52% |
39 |
9 |
Q.14-15 SPLIT SAMPLED
14. Are you more likely or less likely to vote for a candidate for president if they have served as a member of the U.S. Senate or U.S. House of Representatives, or doesn't it make any difference to you?
BASED ON -- 486 -- NATIONAL ADULTS IN FORM A
|
More |
Less |
Doesn't make any difference |
No |
|
|
2003 Oct 10-12 |
18% |
5 |
76 |
1 |
15. Would you be more likely to vote for a candidate for a major political office who has -- [ROTATED: never held elected office before, (or more likely to vote for someone who has) previously held elected office]?
BASED ON -- 518 -- NATIONAL ADULTS IN FORM B
|
Never held office |
Previously held office |
No opinion |
|
|
2003 Oct 10-12 |
26% |
64 |
10 |
16. Do you consider each of the following occupations to be excellent, good, fair, or poor for preparing someone to be an effective president? How about -- [RANDOM ORDER]?
|
2003 Oct 10-12 |
|
|
|
|
No opinion |
|
Governor of a state |
17% |
51 |
23 |
8 |
1 |
|
A member of U.S. Senate/House of Representatives |
14% |
50 |
27 |
7 |
2 |
|
A general in the U.S. military |
14% |
41 |
32 |
12 |
1 |
|
A business executive |
9% |
38 |
35 |
17 |
1 |
