Performance management means different things to different people. For the sake of discussion, let's agree that it refers to monitoring, evaluating, and influencing employees' job performance.
That's a good, simple definition. But evidence suggests there's nothing simple about implementing an effective performance management system. Many companies try, but few can point to improved results in company financials resulting from their performance management systems. What makes performance management so difficult in practice? Two simple concepts that are tough to execute: objective measurement and improvement plans for individual teams.
Measurement poses a problem because it must be objective, and ratings of employee performance formulated by a superior never are. Indeed, many performance management systems are based primarily on supervisor ratings and are thus doomed to fail -- because ratings from a superior essentially measure the personal relationship between a manager and an employee and not much else. In this kind of a system, employees focus on getting good ratings from the boss. And that has little or nothing to do with business outcomes. (By the way, it doesn't matter what questions are asked under the guise of objectivity -- the answers are always primarily a measure of the superior/subordinate relationship.)
A measurement that works
While difficult to achieve, objective measurement isn't impossible. Through extensive research in employee performance measurement, The Gallup Organization has developed HumanSigma, a process to measure and manage an organization's human capital. HumanSigma builds on two metrics that can be applied in most businesses and workgroups: a workplace measure (Q12) and a customer measure (CE11) (See "Feedback for Real" and "The Constant Customer" in See Also).
Most importantly, though, HumanSigma is an objective measure of workgroup performance that is strongly tied to financial results. The higher a workgroup's HumanSigma score, the more value that group creates for the company (See "Managing Your Human Sigma" in See Also). Measuring HumanSigma puts companies on a path to effective performance management.
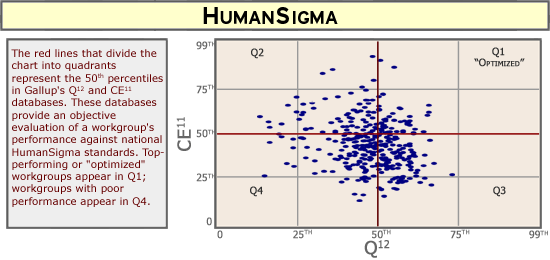
However, an effective performance management measure must not only be objective, it must also support team improvement. HumanSigma does just that. For example, in the chart below, the two components of HumanSigma -- Q12 and CE11 -- are plotted for each team. The resulting scatter plot forms the basis of an improvement-driven evaluation.

The HumanSigma graph is divided into four quadrants. The lines that divide it represent the 50th percentile of performance as measured by Gallup's extensive employee and customer engagement databases. Scores above the 50th percentile represent above-average performance, and scores below the 50th percentile represent below-average performance. The best performing workgroups are those with optimized performance -- that is, they're above average in both customer and employee engagement. The optimized workgroups appear in quadrant 1 (Q1).
Most similar charts are ambiguous because the placement of the lines that determine the quadrants is subjective. (The most common placement is the one that suits the purposes of the chart creator.) But this chart provides an objective view of current performance levels against national standards.
The chart also provides insights into each team's performance -- and gives clues to how teams can improve it.
Here are short descriptions of teams that fall into each of the four quadrants:
Q1 -- The Good: Their optimized performance levels indicate that these workgroups are committed to engaging employees and customers. Feed this workgroup more resources, more freedom, and higher goals.
Q2 -- The Bad, Type One: These teams' CE11 scores indicate that their customer service performance is good, but their Q12 scores suggest that working conditions are poor. (Here comes the labor union!)
Q3 -- The Bad, Type Two: These teams have above-average employee engagement, as measured by their Q12 scores -- but that engagement hasn't resulted in customer engagement, as shown by their CE11 scores. These teams have fun at the company's expense -- they all get along, but they don't get anything done.
Q4 -- The Ugly: These teams have below-average scores for both employee and customer engagement -- clearly not an optimal situation. Disband them. Their employees might be good performers in other circumstances, but not at this job and not with these managers.
Beyond measurement
Once the measurement is right and an initial evaluation of current team performance levels is complete, the real fun begins: helping each team get better. And that takes an improvement plan built at the team level around current performance levels, performance targets, and team needs. The key questions companies must ask are: Where is this team now? Where does the team need to go? What does the team need to get there? What path is the team going to take? Which manager will lead them on the journey?
The answers to each of these questions and the way those answers are implemented determine whether individual employee job performance -- and the resulting company financial performance -- improve. In most situations, improvement won't come from sweeping process changes. Instead, improvement will come one step at a time, one day at a time, from individual managers and employees who make smart decisions.
The next article in this series will feature real managers who have dealt with good, bad, and ugly teams. Their stories are compelling studies of how performance management works in the real world.