PRINCETON, NJ -- According to the latest USA Today/Gallup poll, Americans are much more positive in their assessments of the Democratic Party than of the Republican Party -- consistent with a trend Gallup has measured since April 2006. Over the past several months, the public's ratings of the Republican Party have grown slightly more positive. The vast majority of Republicans and Democrats rate their respective parties favorably, while independents have a more positive than negative view of the Democratic Party, and a more negative than positive view of the Republican Party.
Party Ratings
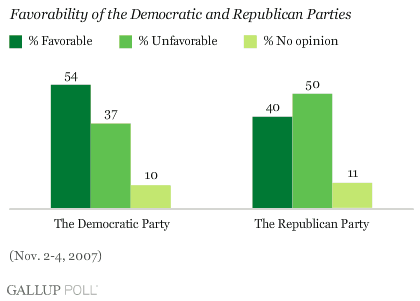
The Nov. 2-4, 2007, poll finds 54% of Americans saying they have a favorable opinion of the Democratic Party, while 37% have an unfavorable opinion. Ratings of the Republican Party are much more negative, with 40% favorable and 50% unfavorable.

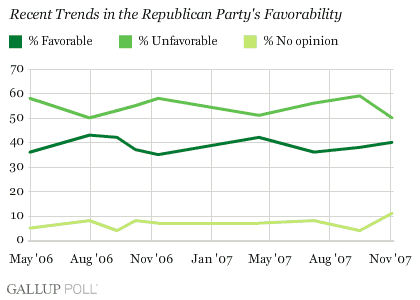
The public's ratings of the Republican Party have improved slightly in recent months, edging up from 36% in July to 40% in early November. The current ratings are at roughly the levels seen in April and at several points in 2006. The party's unfavorable ratings are down nine points since September and are now on the low end of what Gallup has measured since 2006.

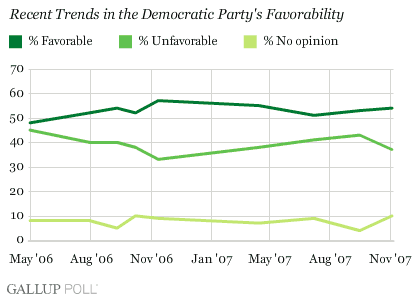
Ratings of the Democratic Party have not shown much change since July 2006, with between 51% and 57% rating the party favorably over this time.

Overall, the vast majority of both Republicans and Democrats have a favorable opinion of their respective parties -- 91% of Democrats rate the Democratic Party favorably, and 86% of Republicans rate the Republican Party favorably. Interestingly, a higher percentage of Republicans than Democrats positively assess the opposing party (16% vs. 9%). Independents are more positive than negative in their views of the Democratic Party, and much more negative than positive in their ratings of the Republican Party -- accounting in large part for the Democrats’ superior favorable image with the public.
|
Favorability of Political Party by Political Attitudes
|
||||
|
|
The Democratic Party |
The Republican Party |
||
|
|
Favorable |
Unfavorable |
Favorable |
Unfavorable |
|
|
% |
% |
% |
% |
|
Republicans |
16 |
80 |
86 |
11 |
|
Independents |
47 |
40 |
33 |
55 |
|
Democrats |
91 |
6 |
9 |
87 |
Democratic Party vs. Republican Party Ratings Trends
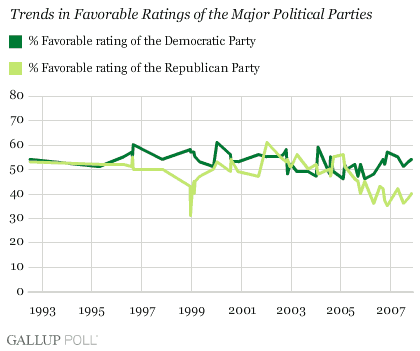
Americans' ratings of the two political parties were similar when Gallup started tracking this measure in 1992. This pattern remained until Bill Clinton's second term in office, during which Americans generally rated the Democratic Party more positively than the Republican Party. Ratings of the Republican Party reached their lowest level in December 1998, right after the House voted to impeach Clinton in the Monica Lewinsky scandal. At that time, just 31% of Americans viewed the Republican Party favorably, compared with a 57% favorable rating for the Democratic Party.
During much of President George W. Bush's first term in office, and even in the earlier parts of his second term, Americans again gave similar ratings to the two parties, with a few instances in which Republicans were rated more favorably and a few others in which Democrats were rated more positively.
Since April 2006, ratings of the Democratic Party have been consistently and substantially higher than those of the Republican Party, with the largest difference coming after the 2006 midterm elections, when the Democrats gained control of both houses of Congress for the first time in 12 years. In that November poll, 57% rated the Democratic Party favorably, while only 35% rated the Republican Party favorably.

Americans’ Identification With the Political Parties
According to Gallup’s most recent poll, 41% of Americans currently consider themselves to be political independents (or members of a third party), 25% identify themselves as Republicans, and 34% as Democrats. With some variation in the precise percentages, since February, Americans have consistently been most inclined to identify themselves as independents.
As Gallup Poll Senior Editor Lydia Saad pointed out earlier this year (see Related Items), it is not unusual for more Americans to identify themselves as independents in non-election years than do so in election years.
Survey Methods
Results are based on telephone interviews with 1,024 national adults, aged 18 and older, conducted Nov. 2-4, 2007. For results based on the total sample of national adults, one can say with 95% confidence that the maximum margin of sampling error is ±3 percentage points. In addition to sampling error, question wording and practical difficulties in conducting surveys can introduce error or bias into the findings of public opinion polls.
The Republican Party
|
|
Favorable |
Unfavorable |
No opinion |
|
|
% |
% |
% |
|
2007 Nov 2-4 |
40 |
50 |
11 |
|
2007 Sep 14-16 |
38 |
59 |
4 |
|
2007 Jul 6-8 |
36 |
56 |
8 |
|
2007 Apr 13-15 |
42 |
51 |
7 |
|
2006 Nov 9-12 |
35 |
58 |
7 |
|
2006 Oct 6-8 |
37 |
55 |
8 |
|
2006 Sep 7-10 |
42 |
53 |
4 |
|
2006 Jul 28-30 |
43 |
50 |
8 |
|
2006 Apr 28-30 |
36 |
58 |
5 |
|
2005 Dec 16-18 |
45 |
48 |
7 |
|
2005 Oct 13-16 |
40 |
50 |
10 |
|
2005 Sep 8-11 |
45 |
45 |
10 |
|
2005 Jul 22-24 |
46 |
45 |
9 |
|
2005 Apr 1-2 |
50 |
44 |
6 |
|
2005 Feb 25-27 |
51 |
42 |
7 |
|
2005 Feb 4-6 |
56 |
39 |
5 |
|
2004 Sep 13-15 |
55 |
41 |
4 |
|
2004 Sep 3-5 |
53 |
40 |
7 |
|
2004 Aug 23-25 ^ |
50 |
41 |
9 |
|
2004 Jul 30-Aug 1 |
47 |
45 |
8 |
|
2004 Jul 19-21 ^ |
50 |
43 |
7 |
|
2004 Jan 29-Feb 1 |
48 |
45 |
7 |
|
2004 Jan 2-5 |
52 |
40 |
8 |
|
2003 Sep 8-10 |
50 |
44 |
6 |
|
2003 Mar 29-30 |
56 |
33 |
11 |
|
2003 Jan 3-5 |
51 |
38 |
11 |
|
2002 Dec 16-17 |
51 |
38 |
11 |
|
2002 Nov 8-10 |
54 |
38 |
8 |
|
2002 Oct 21-22 |
53 |
35 |
12 |
|
2002 Sep 5-8 |
54 |
40 |
6 |
|
2002 Jul 26-28 |
55 |
36 |
9 |
|
2002 Jan 11-14 |
61 |
30 |
9 |
|
2001 Sep 7-10 |
47 |
48 |
5 |
|
2000 Nov 13-15 |
49 |
43 |
8 |
|
2000 Aug 4-5 |
54 |
37 |
9 |
|
2000 Jul 25-26 |
49 |
39 |
12 |
|
2000 Jan 7-10 |
53 |
41 |
6 |
|
1999 Nov 18-21 |
50 |
44 |
6 |
|
1999 Apr 30-May 2 |
47 |
44 |
9 |
|
1999 Feb 19-21 |
45 |
46 |
9 |
|
1999 Feb 12-13 |
40 |
54 |
6 |
|
1999 Feb 4-8 |
45 |
47 |
8 |
|
1999 Jan 8-10 |
40 |
52 |
8 |
|
1998 Dec 19-20 |
31 |
57 |
12 |
|
1998 Dec 15-16 |
43 |
47 |
10 |
|
1997 Oct 27-29 |
50 |
42 |
8 |
|
1996 Aug 30-Sep 1 † |
50 |
45 |
5 |
|
1996 Aug 16-18 † |
55 |
41 |
3 |
|
1996 Aug 5-7 † |
51 |
44 |
5 |
|
1996 Apr 9-10 |
52 |
41 |
7 |
|
1995 Apr 17-19 |
52 |
42 |
6 |
|
1992 Jul 6-8 † |
53 |
39 |
8 |
|
^ Asked of a half sample |
|||
|
† Based on registered voters |
|||
The Democratic Party
|
|
Favorable |
Unfavorable |
No opinion |
|
|
% |
% |
% |
|
2007 Nov 2-4 |
54 |
37 |
10 |
|
2007 Sep 14-16 |
53 |
43 |
4 |
|
2007 Jul 6-8 |
51 |
41 |
9 |
|
2007 Apr 13-15 |
55 |
38 |
7 |
|
2006 Nov 9-12 |
57 |
33 |
9 |
|
2006 Oct 6-8 |
52 |
38 |
10 |
|
2006 Sep 7-10 |
54 |
40 |
5 |
|
2006 Jul 28-30 |
52 |
40 |
8 |
|
2006 Apr 28-30 |
48 |
45 |
8 |
|
2005 Dec 16-18 |
46 |
45 |
9 |
|
2005 Oct 13-16 |
52 |
36 |
12 |
|
2005 Sep 8-11 |
47 |
41 |
12 |
|
2005 Jul 22-24 |
52 |
38 |
10 |
|
2005 Apr 1-2 |
50 |
42 |
8 |
|
2005 Feb 25-27 |
52 |
41 |
7 |
|
2005 Feb 4-6 |
46 |
47 |
7 |
|
2004 Sep 13-15 |
49 |
45 |
6 |
|
2004 Sep 3-5 |
50 |
41 |
9 |
|
2004 Aug 23-25 ^ |
54 |
36 |
10 |
|
2004 Jul 30-Aug 1 |
55 |
37 |
8 |
|
2004 Jul 19-21 ^ |
48 |
41 |
11 |
|
2004 Jan 29-Feb 1 |
59 |
34 |
7 |
|
2004 Jan 2-5 |
47 |
44 |
9 |
|
2003 Sep 8-10 |
49 |
45 |
6 |
|
2003 Mar 29-30 |
49 |
39 |
12 |
|
2003 Jan 3-5 |
52 |
36 |
12 |
|
2002 Dec 16-17 |
52 |
37 |
11 |
|
2002 Nov 8-10 |
48 |
42 |
10 |
|
2002 Oct 21-22 |
58 |
30 |
12 |
|
2002 Sep 5-8 |
56 |
38 |
6 |
|
2002 Jul 26-28 |
55 |
34 |
11 |
|
2002 Jan 11-14 |
55 |
33 |
12 |
|
2001 Sep 7-10 |
56 |
38 |
6 |
|
2000 Nov 13-15 |
53 |
38 |
9 |
|
2000 Aug 4-5 |
53 |
38 |
9 |
|
2000 Jul 25-26 |
56 |
35 |
9 |
|
2000 Jan 7-10 |
61 |
33 |
6 |
|
1999 Nov 18-21 |
51 |
41 |
8 |
|
1999 Apr 30-May 2 |
53 |
37 |
10 |
|
1999 Feb 19-21 |
55 |
37 |
8 |
|
1999 Feb 12-13 |
56 |
38 |
6 |
|
1999 Feb 4-8 |
57 |
37 |
6 |
|
1999 Jan 8-10 |
57 |
35 |
8 |
|
1998 Dec 19-20 |
57 |
30 |
13 |
|
1998 Dec 15-16 |
58 |
32 |
10 |
|
1997 Oct 27-29 |
54 |
39 |
7 |
|
1996 Aug 30-Sep 1 † |
60 |
36 |
4 |
|
1996 Aug 16-18 † |
55 |
41 |
4 |
|
1996 Aug 5-7 † |
57 |
38 |
5 |
|
1996 Apr 9-10 |
55 |
38 |
7 |
|
1995 Apr 17-19 |
51 |
43 |
6 |
|
1992 Jul 6-8 † |
54 |
38 |
8 |
|
^ Asked of a half sample |
|||
|
† Based on registered voters |
|||
