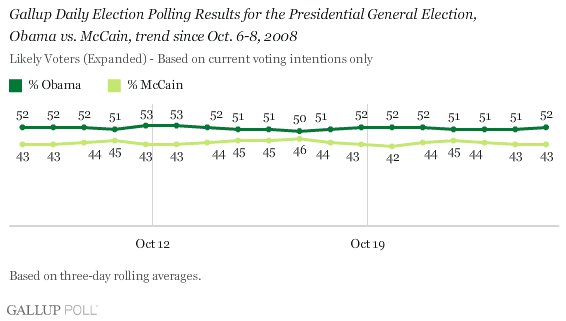
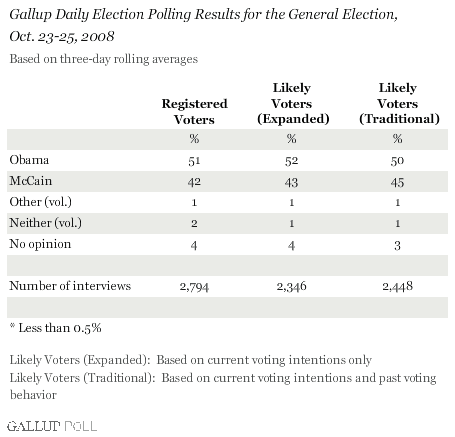
PRINCETON, NJ -- Gallup's likely voter estimates continue to show Barack Obama with a significant lead over John McCain. The traditional model estimates Obama with a 50% to 45% advantage in Oct. 23-25 polling, and the expanded model has Obama leading by 52% to 43%.


Both models have shown fairly stable results since Gallup began tracking likely voter preferences in early October. In the traditional model -- which identifies likely voters based on current voting intentions and self-reported past voting behavior -- Obama's support has ranged narrowly between 49% and 51%, while McCain's support remains in the 44% to 47% range. Today's 50% to 45% Obama advantage matches the average for this model to date.
The expanded model -- which identifies likely voters based on current voting intentions only -- has generally shown Obama doing slightly better, with his support averaging 52% and ranging from 50% to 53%. McCain has averaged 44% in this model, and his support has been between 42% and 46% since early October.
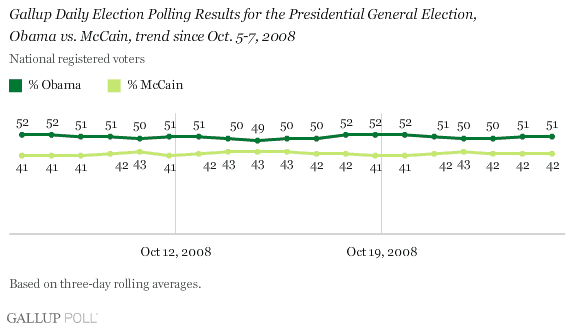
Obama currently holds a 51% to 42% lead over McCain among all registered voters, which equals the average for October to date. That nine percentage point average lead is easily Obama's best of the campaign; his average lead was two points in September, three points in August, four points in July, and three points in June. In April and May, when Obama was still campaigning against Hillary Clinton for the Democratic presidential nomination, McCain and Obama were essentially tied in Gallup Poll Daily tracking presidential election trial heats. (To view the complete trend since March 7, 2008, click here.) -- Jeff Jones


(Click here to see how the race currently breaks down by demographic subgroup.)
Survey Methods
For the Gallup Poll Daily tracking survey, Gallup is interviewing no fewer than 1,000 U.S. adults nationwide each day during 2008.
The general-election results are based on combined data from Oct. 23-25, 2008. For results based on this sample of 2,794 registered voters, the maximum margin of sampling error is ±2 percentage points.
For results based on the sample of 2,448 "traditional" likely voters (based on the model taking into account current voting intentions and self-reported past voting behavior), the maximum margin of sampling error is ±3 percentage points. The traditional likely voter model assumes a turnout of 60% of national adults. The likely voter sample is weighted to match this assumption, so the weighted sample size is 1,821.
For results based on the sample of 2,346 "expanded" likely voters (based on the model taking into account current voting intentions only), the maximum margin of sampling error is ±2 percentage points. The expanded likely voter model does not make any assumptions about turnout level.
Interviews are conducted with respondents on landline telephones (for respondents with a landline telephone) and cellular phones (for respondents who are cell phone only).
In addition to sampling error, question wording and practical difficulties in conducting surveys can introduce error or bias into the findings of public opinion polls.
