This is the third in a four-part series on the "State of the States" being released this week on Gallup.com. The series examines state-by-state differences in party affiliation, religiosity, consumer confidence, and employer hiring and letting go, based on Gallup Poll Daily tracking data collected throughout 2008.
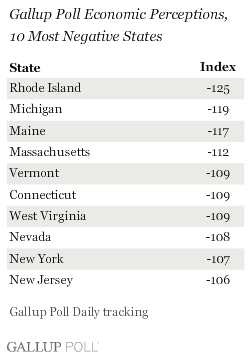
PRINCETON, NJ -- According to combined Gallup Poll Daily tracking for all of 2008, residents of Rhode Island had the lowest level of confidence in the U.S. economy of any state in the union last year, followed by Michigan, Maine, and Massachusetts. Residents of North Dakota, Utah, and Texas were the least economically discouraged, although regardless of relative differences, Americans living in every state have been significantly more negative than positive about the nation's economy over the past year.


The top 10 states in economic confidence -- led by North Dakota, Utah, and Texas -- are all oil-producing states whose economies, to varying degrees, benefited from surging oil prices in 2008. However, a strong farm industry may have been the bigger positive factor for some of these states, such as Nebraska.
The bottom 10 states -- including Rhode Island, Michigan, Maine, and Massachusetts -- are mostly clustered in the East, where the crisis in the financial services industry only adds to the labor market problems created by a withering manufacturing base and a construction slowdown.
The source of economic pessimism in Michigan is no mystery given the woes besetting the U.S. auto industry. Rhode Island has been competing with Michigan in recent months for the highest unemployment rate of any state in the country.
The Bad, the Worse, and the Ugly
Gallup's Economic Perceptions Index is based on two questions -- one asking Americans to rate current U.S. economic conditions and the other asking them whether those conditions are getting better or getting worse. The Index score is the sum of net positive ratings of the current economy ([% excellent plus % good] minus % poor) and the net positive outlook for the economy (% getting better minus % getting worse). The maximum values of the Index are +200 for the most positive possible responses and -200 for the most negative.
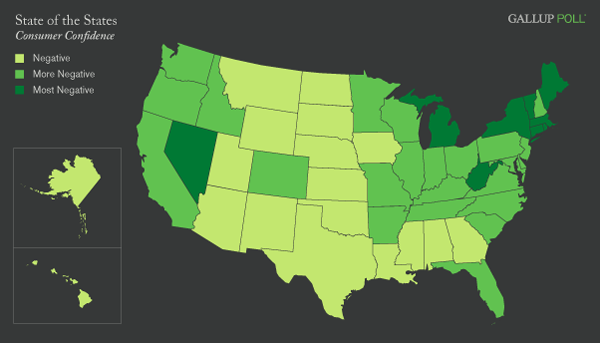
In 2008, the average state scores ranged from -69 on the high end (North Dakota) to -125 on the low end (Rhode Island). Dividing these scores into equal thirds creates three categories of states as shown on the accompanying map: those simply Negative in their economic perceptions (scoring -69 to -88 on the Index), those More Negative in their perceptions (-89 to -107), and those Most Negative (-108 to -125). (The full data for all states appear at the end of the article.)

As is clear from the map, a broad swath of the center of the country descending straight down from Montana and North Dakota to the Southern border has the least negative perceptions of the economy, while most states on the West Coast and in the Eastern half of the country are more negative.
These findings are drawn from Gallup's 2008 daily tracking program, including interviews with more than 185,000 national adults from Jan. 2, 2008, through the end of the year. The overall Gallup Economic Perceptions Index score is thus an average of consumer attitudes across a period of declining confidence (the Index fell from -46 at the start of 2008 to -113 at the end of the year), with a particularly sharp drop occurring after the start of the financial collapse in mid-September. Current consumer attitudes are therefore more negative than what is indicated by the 2008 Index values, but in all likelihood the 2008 rank order of the states continues to hold in early 2009.
Bottom Line
Gallup's Economic Confidence Index measures public perceptions about the U.S. economy, but it's clear that those perceptions are colored by the economic picture closer to home. Residents of Rhode Island, Michigan, and other states hit hard by unemployment, falling housing prices, and other recessionary trends have a much more severe assessment of national conditions than do those in better-performing states. But no state is blind to the broader economic picture, as negative perceptions heavily outweigh positive ones, even in places where jobs can, mercifully, still be found.
Survey Methods
Results are based on telephone interviews with 186,718 national adults, aged 18 and older, conducted in 2008 as part of Gallup Poll Daily tracking. (Economic questions were asked of a random half-sample of survey respondents.) For results based on the total sample of national adults, one can say with 95% confidence that the maximum margin of sampling error is ±1 percentage point.
The margin of sampling error for most states is ±2 percentage points, but is as high as ±6 points for the District of Columbia, Wyoming, and North Dakota.
Interviews were conducted with respondents on land-line telephones (for respondents with a land-line telephone) and cellular phones (for respondents who are cell-phone only).
In addition to sampling error, question wording and practical difficulties in conducting surveys can introduce error or bias into the findings of public opinion polls.

