GALLUP NEWS SERVICE
PRINCETON, NJ -- An abortion rights march of "historic size" is being planned for Washington, D.C., this weekend. Hollywood celebrities will join pro-choice activists from all over the country on the national mall Sunday in a show of force intended to forestall what organizers fear is an inevitable reversal of Roe v. Wade under a re-elected President George W. Bush. Several pro-life groups are promising their own counter-demonstrations.
The march presents a good opportunity to review where the public stands on abortion, and how abortion is likely to factor as an election issue.
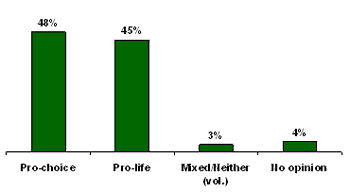
Americans are sharply divided in their identification with the two political sides of the abortion debate: 48% consider themselves "pro-choice," while 45% identify as "pro-life."
| What Do You Consider Yourself? |
 |
| Oct. 24-26, 2003 |
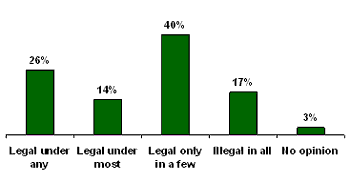
A different question designed to tap more specific attitudes about the legality of abortion finds Americans generally favoring restrictive laws. More than half the public says abortion should be "legal only in a few circumstances" (40%) or "illegal in all circumstances" (17%). Four in 10 favor less restrictive laws, saying abortion should be "legal under any circumstances" (26%) or "legal under most circumstances" (14%).
| Circumstances in Which Abortion Should Be Legal |
 |
| Oct. 24-26, 2003 |
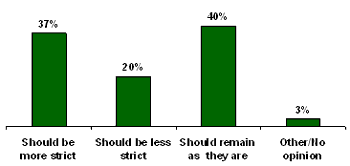
But when asked whether the current laws should be made more strict, less strict, or kept as they are, only 37% want stricter laws. The plurality -- 40% -- wants the laws to remain as they are, while a smaller percentage (20%) thinks they should be less strict.
| Preference for Abortion Laws |
 |
| Jan. 12-15, 2004 |
The Court Scare
This leads to one of the prime motivating factors behind this weekend's event: the future makeup of the Supreme Court.
Kate Michelman, president of NARAL Pro-Choice America, is quoted in Newsweek magazine this week: "There's no question that a woman's right to choose could be lost if this president is re-elected because the Supreme Court will be in his hands and the future of Roe is in jeopardy. I believe that one of the central issues of this march is the right to choose."
According to a report on the Bush administration's family planning policies published on Planned Parenthood's Web site: "The Bush administration has made clear its goal of overturning Roe v. Wade and denying women in this country and around the world access to safe, legal abortion at all stages of a pregnancy."
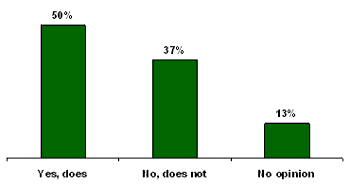
Do Americans believe these claims? About half do, a third do not, and the rest are uncertain. Last fall, a CNN/USA Today/Gallup poll measured public reaction to the charge that Bush wants to ban all abortions in the United States. Exactly 50% said he does; 37% said he does not, while 13% had no opinion.
| Does Bush Want to Ban All Abortions? |
 |
| Oct. 24-26, 2003 |
A different question is whether the perception of being anti-abortion will hurt Bush at the polls in November. It appears that the net effect of perceptions that Bush wishes to ban abortion is not entirely damaging to his potential re-election. Of those who think Bush will ban all abortions, more than half (58%) said this will have no effect on their support for him. Seventeen percent said it would make them more likely to vote for him, while just slightly more, 23%, said it will make them less likely.
Voter Priorities
The degree to which Bush's image on abortion will impact the election outcome may depend on the general significance of abortion as a voting issue.
A CNN/USA Today/Gallup poll from early February shows that abortion ranks among the least important issues to voters. Roughly half of Americans (52%) say the candidates' positions on abortion will be extremely important in influencing their votes for president. By contrast, 86% say education and the economy will be extremely or very important, and 80% to 85% rate terrorism, healthcare, and the situation in Iraq this highly. Clearly, there is much competing for voters' attention. Of the 14 issues rated, the only issue falling below abortion is same-sex marriage.
How important will the candidates' positions on each of the following issues be in influencing your vote for president -- extremely important, very important, somewhat important, or not important?
|
Feb 2004 |
Extremely/Very |
|
% |
|
|
Education |
86 |
|
The economy |
86 |
|
Terrorism |
85 |
|
Healthcare |
82 |
|
The situation in Iraq |
80 |
|
Taxes |
74 |
|
The federal budget deficit |
72 |
|
Foreign affairs |
65 |
|
The environment |
62 |
|
Corporate corruption |
60 |
|
Immigration |
55 |
|
Gun policy |
53 |
|
Abortion |
52 |
|
Same-sex marriage |
44 |
Trends
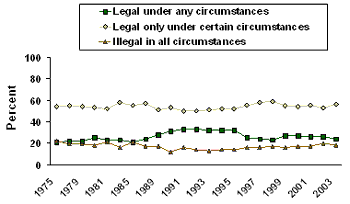
Abortion attitudes have been quite stable over the past several years. In fact, for most of the nearly 30 years Gallup has been tracking abortion attitudes, the majority has preferred to see abortion legal, but only under certain circumstances. The percentage holding one or the other of the extreme positions has shifted somewhat. The percentage saying abortion should be legal in all circumstances gradually rose from 21% in 1975 to 34% in 1992, and then slipped back to the 25% range in 1996, at about which it has stayed ever since. The percentage saying abortion should never be legal has varied from a low of 12% in 1995 to a high of 22% as recently as May 2002.
| When Abortion Should Be Legal |
 |
Where Women Stand
Gallup typically finds small differences in men and women's attitudes on abortion. Consistent with this, an aggregate of abortion surveys from 2001-2003 finds no statistical difference in the percentage of men and women identifying with the pro-choice and pro-life labels. Overall, 47% of men and 48% of women call themselves "pro-choice," while 45% of men and 43% of women call themselves "pro-life."
Younger women and baby boom-era women are a bit more likely to be pro-choice than older women are. Given the sample sizes of these subgroups, the slight difference in views between 18- to 29-year-olds and 30- to 49-year-olds is not significant, but the average "pro-choice" figure for women aged 18 to 49 (52%) is significantly higher than the average of 42% among women 50 and older.
|
Abortion Position of Women, by Age |
||||
|
Women 18-29 |
Women 30-49 |
Women 50-64 |
Women 65+ |
|
|
% |
% |
% |
% |
|
|
Pro-choice |
54 |
51 |
44 |
39 |
|
Pro-life |
39 |
42 |
47 |
48 |
|
Mixed/Neither/Unsure |
7 |
7 |
9 |
13 |
The Generation Gap
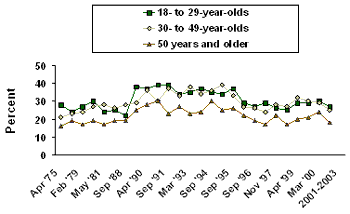
Since Gallup's initial polling on abortion in 1975, Gallup has recorded a persistent gap in abortion views between younger and older Americans. According to Gallup's long-term abortion measure on the legality of abortion, 18- to 29-year-olds and 30- to 49-year-olds typically share similar outlooks on abortion, while those 50 and older tend to be more conservative. This is demonstrated in the graph, which plots the percentage of each group saying abortion should be legal "under any circumstances."
| Abortion Attitudes by Age Percentage saying abortion should be legal under any circumstances |
 |
Implications
Gallup trends suggest that the public is no more concerned today about the abortion issue than it was in the last two presidential elections. Americans are closely divided in their identification with the pro-choice and pro-life sides, and generally reject extreme positions on abortion in favor of middle-of-the-road positions.
Exit polling in 1996 and 2000 showed that abortion was an important issue for only 9% and 14% of voters, respectively. Furthermore, in both years, voters for whom the issue was critical were slightly more likely to vote for the Republican candidate than the Democratic candidate. That reflects the fact that people opposed to abortion have traditionally been more likely to say the issue is important than people who are in favor of allowing abortions.
Given current attitudes, there is no reason to expect that 2004 will be any different. On the other hand, those mobilizing hundreds of thousands of Americans to march on Washington this weekend surely intend to blunt that trend by communicating to pro-choice voters all across America that the stakes are higher than ever in this election. It will be important to monitor public attitudes on abortion in the weeks and months ahead to see if they succeed in that mission.
Survey Methods
Results based on individual surveys are based on telephone interviews with a randomly selected national sample of roughly 1,000 adults, aged 18 and older. For results based on this sample, one can say with 95% confidence that the maximum error attributable to sampling and other random effects is ±3 percentage points. Results based on the aggregate of 2001-2003 abortion surveys are based on interviews with 3,029 national adults, including 1,572 women. In addition to sampling error, question wording and practical difficulties in conducting surveys can introduce error or bias into the findings of public opinion polls.
36. Do you think abortions should be legal under any circumstances, legal only under certain circumstances, or illegal in all circumstances?
|
Legal |
Legal only |
|
|
|
|
% |
% |
% |
% |
|
|
2003 Oct 24-26 |
26 |
55 |
17 |
2 |
|
2003 May 5-7 |
23 |
57 |
19 |
1 |
|
2003 Jan 10-12 |
24 |
57 |
18 |
1 |
|
2002 May 6-9 |
25 |
51 |
22 |
2 |
|
2002 Mar 22-24 |
27 |
53 |
19 |
1 |
|
2002 Feb 8-10 |
26 |
54 |
18 |
2 |
|
2001 Aug 10-12 |
26 |
56 |
17 |
1 |
|
2001 May 10-14 |
26 |
58 |
15 |
1 |
|
2001 Mar 26-28 |
26 |
51 |
18 |
5 |
|
2000 Mar 30-Apr 2 |
28 |
51 |
19 |
2 |
|
2000 Jan 13-16 |
26 |
56 |
15 |
3 |
|
1999 Apr 30-May 2 |
27 |
55 |
16 |
2 |
|
1998 Jan 16-18 |
23 |
59 |
17 |
1 |
|
1997 Nov 6-9 |
26 |
55 |
17 |
2 |
|
1997 Aug 12-13 |
22 |
61 |
15 |
2 |
|
1996 Sep 20-22 |
24 |
52 |
17 |
7 |
|
1996 Jul 25-28 |
25 |
58 |
15 |
2 |
|
1995 Sep 22-24 |
31 |
54 |
12 |
3 |
|
1995 Feb 24-26 |
33 |
50 |
15 |
2 |
|
1994 Sep 6-7 |
33 |
52 |
13 |
2 |
|
1994 Mar 28-30 |
31 |
51 |
15 |
3 |
|
1993 Mar 12-14 |
32 |
51 |
13 |
4 |
|
1992 Jul 23-24 ^ |
34 |
48 |
15 |
3 |
|
1992 Jun 29 |
34 |
48 |
13 |
5 |
|
1992 Jan 16-19 |
31 |
53 |
14 |
2 |
|
1991 Sep 5-8 |
33 |
49 |
14 |
4 |
|
1991 May 30-Jun 2 |
32 |
50 |
17 |
1 |
|
1990 Apr 5-20 |
31 |
53 |
12 |
4 |
|
1989 Jul 6-9 |
29 |
51 |
17 |
3 |
|
1989 Jul 6-7 ^ |
29 |
51 |
17 |
3 |
|
1989 Apr 12-13 ^ |
27 |
50 |
18 |
5 |
|
1988 Sep 25-Oct 1 |
24 |
57 |
17 |
2 |
|
1985 Jan 3-4 ^ |
21 |
55 |
21 |
3 |
|
1983 Jun 24-27 |
23 |
58 |
16 |
3 |
|
1981 May 8-11 |
23 |
52 |
21 |
4 |
|
1980 Jul 11-14 |
25 |
53 |
18 |
4 |
|
1979 Feb 23-26 |
22 |
54 |
19 |
5 |
|
1977 Dec 9-12 |
22 |
55 |
19 |
4 |
|
1975 Apr 4-7 |
21 |
54 |
22 |
3 |
|
^ Gallup/Newsweek |
37. (If certain circumstances)Do you think abortion should be legal in most circumstances or only in a few circumstances?
COMBINED RESPONSES (Q.36-37)
|
Legal |
Legal |
Legal only |
Illegal |
|
|
|
% |
% |
% |
% |
% |
|
|
2003 Oct 24-26 |
26 |
14 |
40 |
17 |
3 |
|
2003 May 5-7 |
23 |
15 |
42 |
19 |
1 |
|
2003 Jan 10-12 |
24 |
14 |
42 |
18 |
2 |
|
2002 May 6-9 |
25 |
12 |
39 |
22 |
2 |
|
2002 Mar 22-24 |
27 |
12 |
40 |
19 |
2 |
|
2001 Aug 10-12 |
26 |
12 |
43 |
17 |
2 |
|
2001 May 10-14 |
26 |
15 |
41 |
15 |
3 |
|
2001 Mar 26-28 |
26 |
13 |
38 |
18 |
5 |
|
2000 Mar 30-Apr 2 |
28 |
11 |
38 |
19 |
4 |
|
2000 Jan 13-16 |
26 |
17 |
39 |
15 |
3 |
|
1999 Apr 30-May 2 |
27 |
12 |
42 |
16 |
3 |
|
1998 Jan 16-18 |
23 |
16 |
42 |
17 |
2 |
|
1997 Nov 6-9 |
26 |
15 |
40 |
17 |
2 |
|
1997 Aug 12-13 |
22 |
12 |
48 |
15 |
3 |
|
1996 Jul 25-28 |
25 |
13 |
43 |
15 |
4 |
|
1995 Sep 22-24 |
31 |
14 |
39 |
12 |
4 |
|
1995 Feb 24-26 |
32 |
9 |
41 |
15 |
3 |
|
1994 Sep 6-7 |
33 |
13 |
38 |
13 |
3 |
38. With respect to the abortion issue, would you consider yourself to be pro-choice or pro-life?
|
|
|
MIXED/ |
DON'T |
|
|
|
2003 Oct 24-26 |
48 |
45 |
3 |
3 |
1 |
|
2003 May 5-7 |
48 |
45 |
2 |
4 |
1 |
|
2002 May 6-9 |
47 |
46 |
3 |
3 |
1 |
|
2001 Aug 10-12 |
46 |
46 |
3 |
3 |
2 |
|
2001 May 10-14 |
48 |
42 |
4 |
4 |
2 |
|
2001 Mar 26-28 |
47 |
41 |
4 |
6 |
2 |
|
2000 Mar 30-Apr 2 |
48 |
43 |
2 |
4 |
3 |
|
1999 Apr 30-May 2 |
48 |
42 |
3 |
4 |
3 |
|
1998 Jan 16-18 |
48 |
45 |
3 |
2 |
2 |
|
1997 Nov 6-9 |
51 |
40 |
3 |
3 |
3 |
|
1997 Aug 12-13 |
47 |
44 |
3 |
3 |
3 |
|
1996 Jul 25-28 |
53 |
36 |
5 |
3 |
3 |
|
1995 Sep 22-24 |
56 |
33 |
5 |
3 |
3 |
|
NOTE: Trends taken only from polls where previous two questions (abortion legal under which circumstances) also asked. |
|||||
39. Now I would like to ask your opinion about a specific abortion procedure known as "late term" abortion or "partial birth" abortion, which is sometimes performed on women during the last few months of pregnancy. Do you think that – [ROTATED: the government should make this procedure illegal, (or do you think that) this procedure should be legal]?
|
Illegal |
Legal |
No opinion |
|
|
2003 Oct 24-26 |
68% |
25 |
7 |
40. Just your best guess, do you think George W. Bush wants to ban all abortions in the United States, or not?
|
Yes, does |
No, does not |
No opinion |
|
|
2003 Oct 24-26 |
50% |
37 |
13 |
41. Does that make you –[ROTATED: more likely (or) less likely] – to vote for Bush, or wouldn't that affect your vote?
|
More |
Less |
No |
No |
|
|
2003 Oct 24-26 |
17% |
23 |
58 |
2 |
COMBINED RESPONSES (Q.40-41)
|
2003 Oct 24-26 |
||
|
% |
||
|
Yes, think Bush wants to ban all abortions |
50 |
|
|
(More likely to vote) |
(11) |
|
|
(Less likely to vote) |
(17) |
|
|
(No effect/No opinion) |
(22) |
|
|
No, do not think Bush wants to ban all abortions |
37 |
|
|
(More likely to vote) |
(5) |
|
|
(Less likely to vote) |
(4) |
|
|
(No effect/No opinion) |
(28) |
|
|
No opinion |
13 |
|
8. Now I am going to read a list of some of the issues that will probably be discussed in next year's presidential election campaigns. As I read each one, please tell me how important the candidates' positions on that issue will be in influencing your vote for president -- extremely important, very important, somewhat important, or not important. How about -- [random order]?
J. Abortion
|
Extre- |
Very |
Some- |
Not |
No |
|
|
% |
% |
% |
% |
% |
|
|
2004 Feb 6-8 |
22 |
30 |
28 |
19 |
1 |
|
2000 Aug 4-5 |
29 |
27 |
22 |
20 |
2 |
|
2000 Jul 25-26 |
25 |
27 |
27 |
19 |
2 |
|
2000 Apr 3-9 |
26 |
27 |
30 |
15 |
2 |
SUMMARY TABLE: IMPORTANCE OF ISSUES
|
2004 Feb 6-8 |
Extremely important |
Very |
Extremely/ |
|
% |
% |
% |
|
|
Education |
41 |
45 |
86 |
|
The economy |
38 |
48 |
86 |
|
Terrorism |
43 |
42 |
85 |
|
Healthcare |
38 |
44 |
82 |
|
The situation in Iraq |
39 |
41 |
80 |
|
Taxes |
29 |
45 |
74 |
|
The federal budget deficit |
30 |
42 |
72 |
|
Foreign affairs |
21 |
44 |
65 |
|
The environment |
25 |
37 |
62 |
|
Corporate corruption |
23 |
37 |
60 |
|
Immigration |
19 |
36 |
55 |
|
Gun policy |
21 |
32 |
53 |
|
Abortion |
22 |
30 |
52 |
|
Same-sex marriage |
22 |
22 |
44 |