GALLUP NEWS SERVICE
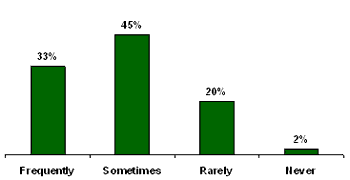
PRINCETON, NJ -- Half of Americans (52%) feel they have enough time to do the things they want to in their daily lives. The other half (48%) feel they do not. Self-reported stress is a bit more pervasive. More than three-quarters of U.S. adults say they experience stress at least sometimes in their daily lives, including a third who are frequently stressed. Only 2 in 10 Americans rarely or never experience stress.
| How Often Do You Experience Stress? |
 |
| Dec. 11-13, 2003 |
The latest results are from Gallup's annual Lifestyle poll, conducted each December. These results were collected in a nationally representative telephone survey conducted Dec. 11-13, 2003.
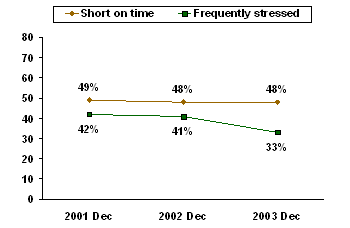
Gallup trends show that while there has been no recent change in the percentage of Americans saying they are short on time, there was a sharp decline between December 2002 and December 2003 in the percentage saying they frequently experience stress in their daily lives -- from 41% to 33%. Roughly 4 in 10 Americans also reported frequent stress in 2001, as well as in Gallup's first measurement of this question, in 1994.
| Time/Stress Trends |
 |
Who Is Most Pressured?
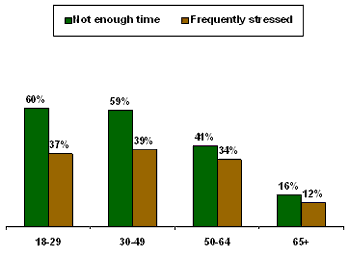
It perhaps comes as no surprise that those between the ages of 18 and 64 tend to be more pressed for time and more stressed than those 65 and older. Older Americans are unlikely either to be employed or to have children in the home, and the data show that one's work and parental status factor into both attitudes.
| Time/Stress by Age |
 |
| Dec. 11-13, 2003 |
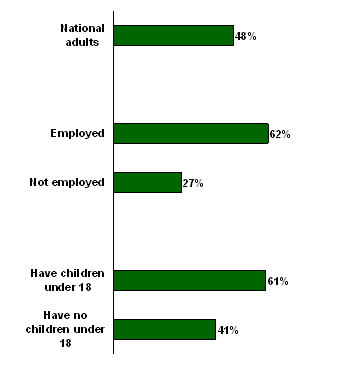
Time constraints seem particularly related to employment. Sixty-two percent of employed Americans feel they have too little time to do what they want in their daily lives, compared with only 27% of non-employed adults -- a 35-point gap.
Sixty-one percent of adults with children under 18 have too little time, compared with 41% of those with no children under 18 -- a 20-point gap.
| Percentage Who Don't "Have Enough Time" |
 |
| Dec. 11-13, 2003 |
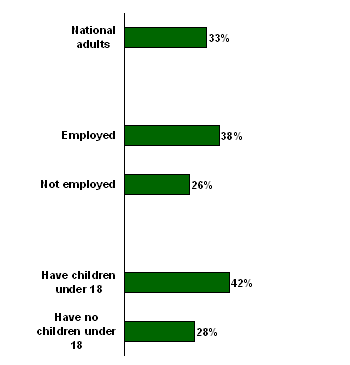
Stress is about equally related to having children as it is to being employed. Thirty-eight percent of employed Americans experience frequent stress, compared with 26% of non-employed adults -- a 12-point gap. Forty-two percent of adults with a child under 18 experience frequent stress, compared with 28% of those with no children under 18 -- a 14-point gap.
| Percentage Who Experience Stress "Frequently" |
 |
| Dec. 11-13, 2003 |
Overall, women tend to be more stressed than men: 38% of women say they experience stress frequently in their daily lives, compared with 28% of men. Women are, of course, more likely to shoulder responsibilities for care of children in the home than are men, but the data suggest that full-time employment is more likely to contribute to stress levels among women than is having a child under 18.
For both women and men who have children under 18, the rate of frequent stress experienced is higher than it is for those with no children in this age bracket, by similar amounts: 13 points and 16 points, respectively. By contrast, the difference in stress levels among women who work full time and women who are not employed is 21 points. This contrasts with only a 13-point difference in frequent stress among working and non-working men.
|
Percentage Experiencing Stress "Frequently"
|
|||||
|
Impact of Children on Stress |
Impact of Employment on Stress |
||||
|
Women |
Men |
Women |
Men |
||
|
Child under 18 |
46 |
39 |
Employed FT |
51 |
32 |
|
No child |
33 |
23 |
Not employed |
30 |
19 |
|
Net Impact |
+13 |
+16 |
Net Impact |
+21 |
+13 |
There are no statistically significant differences in stress levels according to Americans' political identification (i.e., whether they are Republicans or Democrats), or by region of the country, or size of one's local community (urban, suburban, or rural). Also, there is no clear relationship between level of household income and one's stress level.
Decline in Stress
As noted, self-reported stress declined between 2002 and 2003, with the percentage experiencing stress "frequently" falling from 41% to 33%. A comparison of the two polls indicates that this decline occurred quite uniformly across society, with similar changes seen among men, women, different age and income groups, as well as by employment status and whether respondents had children under 18. Thus, these variables provide no insights into the likely reason for the decline in frequent stress.
One possibility is that Americans' personal stress levels may have declined due to improved perceptions of the nation's economy. Although stress is not correlated with personal income levels, it does correspond with one's perception of the nation's economic wellbeing. In 2003, only 27% of those who rated current economic conditions as excellent or good said they frequently experienced stress. Stress levels rose to 34% among those rating economic conditions as only fair, and to 45% among those rating the economy as poor. The decline in stress between 2002 and 2003 could be due to the decline in negative assessments of the economy over the same time period.
|
Current Economic Conditions Rating |
|||
|
Dec 2002 |
Dec 2003 |
Change |
|
|
% |
% |
pct. pts. |
|
|
Excellent/Good |
25 |
37 |
+12 |
|
Only fair |
51 |
44 |
-7 |
|
Poor |
24 |
19 |
-5 |
Survey Methods
These results are based on telephone interviews with a randomly selected national sample of 1,011 adults, aged 18 and older, conducted Dec. 11-14, 2003. For results based on this sample, one can say with 95% confidence that the maximum error attributable to sampling and other random effects is ±3 percentage points. In addition to sampling error, question wording and practical difficulties in conducting surveys can introduce error or bias into the findings of public opinion polls.
13. Generally speaking, do you have enough time to do what you want to do these days, or not?
|
Yes, enough time |
No, not enough time |
No opinion |
|
|
% |
% |
% |
|
|
2003 Dec 11-14 |
52 |
48 |
* |
|
2002 Dec 5-8 |
52 |
48 |
* |
|
2001 Dec 6-9 |
50 |
49 |
1 |
|
1995 Mar 17-19 |
48 |
52 |
* |
|
1990 Sep 16-19 |
49 |
51 |
0 |
|
* Less than 0.5% |
|||
14. In general, how often do you experience stress in your daily life -- never, rarely, sometimes, or frequently?
|
Never |
Rarely |
Sometimes |
Frequently |
No opinion |
||
|
% |
% |
% |
% |
|||
|
2003 Dec 11-14 |
2 |
20 |
45 |
33 |
* |
|
|
2002 Dec 5-8 |
4 |
18 |
37 |
41 |
* |
|
|
2001 Dec 6-9 |
2 |
18 |
38 |
42 |
* |
|
|
1994 Jan 19-30 ^ |
4 |
17 |
39 |
40 |
* |
|
|
^ |
Health Magazine/Gallup Poll |
|||||
|
* Less than 0.5% |
||||||
