PRINCETON, NJ -- Almost 4 out of 10 (38%) Republicans and Republican-leaning independents have an unfavorable opinion of their own party, while just 7% of Democrats and Democratic-leaning independents have an unfavorable opinion of the Democratic Party. Additionally, a May 29-31 USA Today/Gallup poll shows that the top-of-mind images of the Republican Party among Republicans are considerably more negative than are the images of the Democratic Party among Democrats.
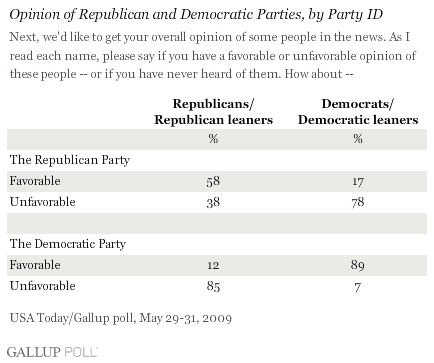
Although it is generally well known that the Republican Party has an image problem today (after all, the Democrats have control of the White House and both houses of Congress), these findings reinforce the depth of that problem by pointing out the degree to which Republicans themselves have a lower opinion of their party than Democrats do of their party, as noted above. The only saving grace, perhaps, is the finding that Democrats are slightly more positive in their opinions of the Republican Party than is the case the other way around.
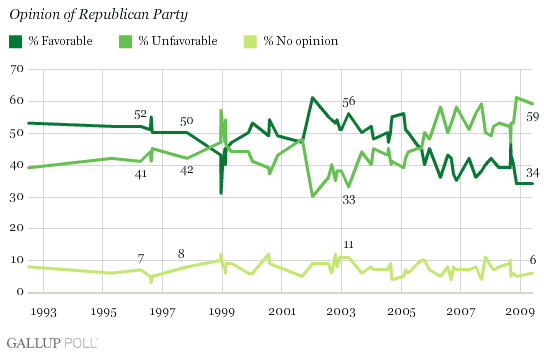
Among all Americans, the poll shows a 19-point advantage for the Democratic Party over the Republican Party when it comes to the two parties' respective favorable images -- a finding little changed from last November, when Gallup last updated the parties' images. Fifty-three percent of Americans today have a favorable opinion of the Democratic Party, compared to just 34% who have a favorable opinion of the Republican Party.
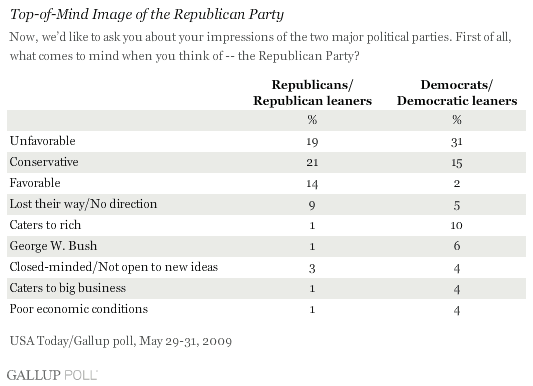
The Republican Party's image deficit is further evidenced by the examination of responses given to open-ended questions asking Americans what comes to mind they think about the Republican Party and, separately, the Democratic Party. (Answers were recorded verbatim and coded into categories.)
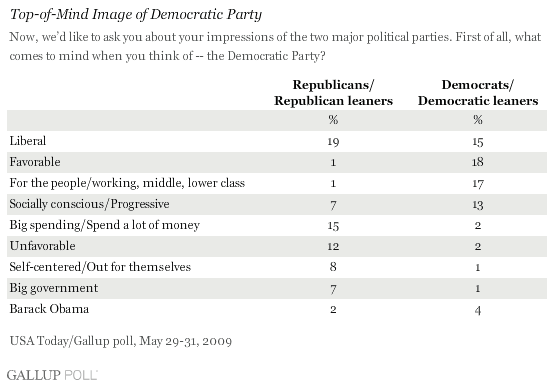
The data make it clear that Republicans are more likely to have negative images of their own party than are Democrats of their party. Among Republicans, two of the top five categories of responses about the GOP's image are categorized by Gallup coders as a general "unfavorable" response (given by 19% of Republicans) and that the GOP has lost its direction (9%).
None of the top five categories of responses about the image of the Democratic Party among Democrats is negative. In fact, one of the starkest contrasts is between the percentage of Democrats whose responses are broadly "unfavorable" (2%) compared to the percentage of Republicans who say the same about their party (19%).
Not surprisingly, both Republicans and Democrats have negative things to say about the other party. For Republicans, the top images associated with the Democratic Party are "liberal," "big spending," "unfavorable," "self-centered/out for themselves," and (tied) "big government" and "socially conscious/progressive." For Democrats, the top images associated with the Republican party are "unfavorable," "conservative," "cater to the rich," "George Bush," and "lost their direction."
Images of the Parties Among All Americans
For the entire U.S. population, the top four categories of images that come to mind first when Americans think about the Republican Party are:
-
Unfavorable
-
Conservative
-
Favorable
-
(Tie) Lost their way and Caters to the rich
The top four categories of images of the Democratic Party are:
-
Liberal
-
Favorable
-
For the people/working, middle, lower class
-
Socially conscious/Progressive
Other than the generic positive and negative responses given by the partisans and opponents of each party, the data reinforce the basic images that generally are associated with the parties; i.e., the Republican Party as conservative and more for the rich, and the Democratic party as liberal and more for the working, middle, and lower classes. All in all, as suggested by the partisan breakout of responses discussed above, the Republican Party has more negative images associated with it than does the Democratic Party.
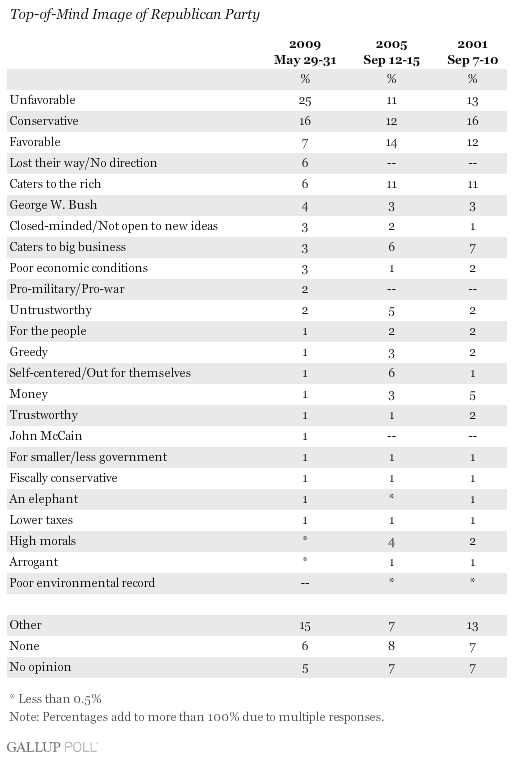
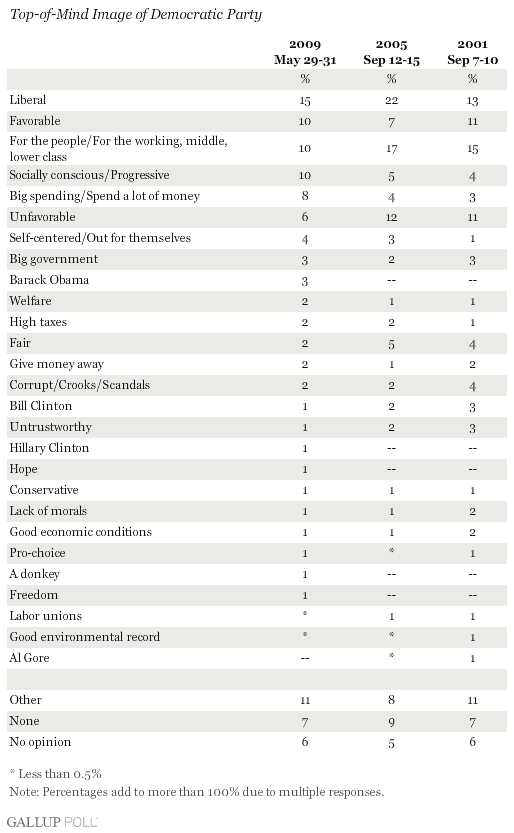
The same open-ended questions were asked twice before -- in September 2001 (just prior to the Sept. 11 terrorist attacks) and in 2005. Since the 2001 poll, the percentage of all Americans who say "unfavorable" when asked about the Republican Party has increased significantly, to 25% today, from 13% in 2001 and 11% in 2005. And while 6% say today that the Republican Party has "lost its way," or "has no direction," no one volunteered this response in either of the two previous surveys. (On the other hand, the percentage who say the GOP caters to the rich and to big business is down from previous surveys.)
There have been a number of changes in the responses to the Democratic open-ended question, but many of these represent fluctuations across the surveys rather than a consistent pattern. Still, the percentage who say the Democratic Party is "for the people" is down some since 2001, as is the percentage whose image of the party is classified broadly as "unfavorable," while the percentages saying "socially conscious" and "big spending" are up.
Implications
All of these data taken together underscore the challenges facing the Republican Party today. Not only are Americans' basic opinions of the GOP significantly more negative than are their opinions of the Democratic Party, but the top-of-mind images of the Republican Party also include more negative categories than is the case for the Democrats.
Perhaps most worrisome to the Republicans is the fact that a substantial minority of Americans who identify with or lean toward the Republican Party also have negative views of the party. Almost 4 out of 10 Republicans say their opinions of the party are unfavorable, and a number of Republicans volunteer that the first thing that comes to mind when they think about the GOP is "unfavorable" or "lost its direction."
Taken together with Gallup Poll evidence showing that almost half of Republicans cannot name an individual who speaks for the party, the results reinforce what Republican leaders already know -- that there are significant challenges ahead as the party gears up for the important 2010 midterm elections and the 2012 presidential election that follows.
Survey Methods
Results are based on telephone interviews with 1,015 national adults, aged 18 and older, conducted May 29-31, 2009. For results based on the total sample of national adults, one can say with 95% confidence that the maximum margin of sampling error is ±3 percentage points.
Interviews are conducted with respondents on land-line telephones (for respondents with a land-line telephone) and cellular phones (for respondents who are cell-phone only).
In addition to sampling error, question wording and practical difficulties in conducting surveys can introduce error or bias into the findings of public opinion polls.
