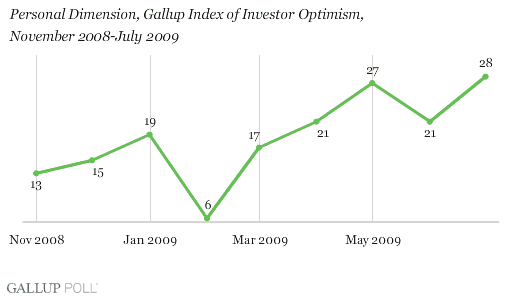
PRINCETON, NJ -- Given the surging equity market -- with the S&P up 45% since its low in March -- it is not surprising that the Gallup Index of Investor Optimism -- a broad measure of investor perceptions -- recovered from its tumble in June, essentially returning to where it was in May. The Index has improved by 61 points from February's -64 reading -- its lowest level since its inception in October 1996.

Portfolio Optimism Increases
Investors became more optimistic about the prospects for their personal portfolios over the next 12 months, with the Personal Dimension of the Index increasing seven points to 28 in July. This means investors are as optimistic as they were in May about their future portfolio performance -- reversing the June decline -- and as positive as they have been at any time this year. Personal portfolio optimism is up 22 points from its record low of six in February.

Economic Pessimism Diminishes
Investors remain pessimistic about the direction of the U.S. economy over the next 12 months with the Economic Dimension of the Index at -31. Still, this is an improvement from June when this dimension was at -42 and is much better than the historic low in February of -70. Investors have not been positive about the economy's direction at any time measured since the recession began in December 2007.

Commentary
While July's surge in investor optimism to nearly match its high for the year makes sense in light of the upside breakout in the equities market, it stands in sharp contrast to the steady deterioration in consumer confidence since early May. Although some market participants were surprised by Tuesday's drop in consumer confidence as reported by the Conference Board, Gallup has been reporting this decline for several weeks.
Of course, it may be that the surge in prices on Wall Street is something more of a short-term bubble -- reflecting market internals and commodity market gyrations -- rather than a sign that investors expect significant economic improvement over the remainder of 2009. In this regard, what is most troubling about the recent surge in the markets is its lack of impact on consumer spending, which remained essentially flat throughout the first seven months of 2009.
Right now, it is hard to see how consumer spending is going to increase without a substantial improvement in the job situation. Yet, Gallup's job creation measure suggests that jobless claims will show another increase when reported by the government this morning.
Given the volatility of investor perceptions over the past several months, the real question to ponder may involve figuring out what the fallout might be if it turns out there is a major Wall Street bubble right now and it bursts. Would investors and consumers simply shrug this off as something to be expected, given the seemingly endless surge in the markets over the past four months? Or, would this depress investors and consumers even further, sending confidence plunging and creating an additional pullback in spending? On the other hand, there might not be a Wall Street bubble to burst.
Author's Note: Gallup's Index of Investor Optimism -- a survey of those having $10,000 or more of investable assets -- peaked at 178 in January 2000, just prior to the bursting of the dot-com bubble. Last year, the Index turned negative for the first time in its history. Before last year, the low for the Index was 5 in March 2003, reflecting investor concerns at the outset of the Iraq war.
Survey Methods
Gallup Poll Daily interviewing includes no fewer than 1,000 U.S. adults nationwide each day during 2008. The Index of Investor Optimism results are based on questions asked of 1,000 or more investors over a three-day period each month, conducted July 24-26, June 25-27, May 26-28, April 21-23, March 16-18, Feb. 17-19, and Jan. 16-18, 2009; and Dec. 16-18, Nov. 24-26, June 3-6, April 25-28, March 28-31, and Feb. 28-March 2, 2008. For results based on these samples, the maximum margin of sampling error is ±3 percentage point.
Results for May 2008 are based on the Gallup Panel study and are based on telephone interviews with 576 national adults, aged 18 and older, conducted May 19-21, 2008. Gallup Panel members are recruited through random selection methods. The panel is weighted so that it is demographically representative of the U.S. adult population. For results based on this sample, one can say with 95% confidence that the maximum margin of sampling error is ±5 percentage points.
For investor results prior to 2008, telephone interviews were conducted with at least 800 investors, aged 18 and older, and having at least $10,000 of investable assets. For the total sample of investors in these surveys, one can say with 95% confidence that the maximum margin of sampling error is ± 4 percentage points.
Interviews are conducted with respondents on land-line telephones (for respondents with a land-line telephone) and cellular phones (for respondents who are cell-phone only).
In addition to sampling error, question wording and practical difficulties in conducting surveys can introduce error or bias into the findings of public opinion polls.
