GALLUP NEWS SERVICE
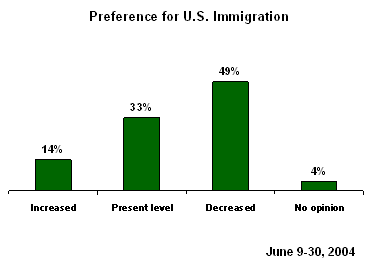
PRINCETON, NJ -- While public opinion of immigration has become less negative than it was in the first year or so after the 9/11 terrorist attacks, it has still not returned to the more positive level seen between 1999 and 2001. In that period, more Americans generally thought immigration should be maintained or increased rather than decreased. Gallup's latest data on immigration, collected as part of the annual Minority Rights and Relations poll, finds only 14% of Americans wanting to see immigration increased; another 33% want it kept at the present level while 49% want it decreased.

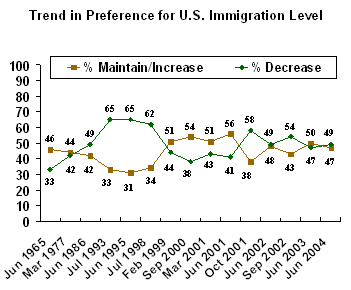
At the same time, the current figures are not nearly as negative as those seen in the early 1990s, when immigrants were widely viewed as a threat to American workers in tough economic times. Gallup's lowest measures of support for immigration appeared in July 1993 and June 1995, when 65% wanted a decrease.
Combining the percentage of Americans in support of maintaining or increasing immigration, and contrasting this with the percentage favoring a decrease in immigration, the following graph shows the historical shifts on this measure.

The percentage favoring a reduction in immigration rose between 1965 and 1993, and then leveled off at about 65% in 1995. This lasted until the late 1990s, when Gallup recorded a reversal. In 1999, the majority of Americans felt immigration should be maintained or increased, and this majority actually grew larger until the 9/11 attacks occurred. A sharp and sudden change occurred between June and October 2001, spanning the 9/11 attacks, and once again more Americans wanted to curtail immigration. These feelings have since tempered somewhat, but even today, the public tilts in favor of less immigration: 49% favor a decrease, while 47% favor an increase or maintaining the current level.
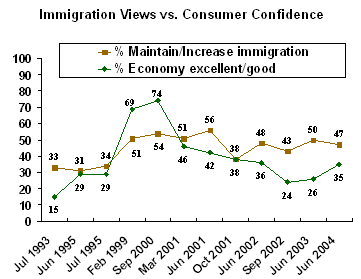
The fact that Saudis and other Arabs living in the United States conducted the 9/11 terrorist attacks gave Americans a new reason to be wary of immigration. Historically, however, immigration views have tended to be linked with economics. As the following graph shows, prior to 2001, support for increased immigration was low when the percentage giving high marks to the economy was low. The increase in support for immigration seen in 1999 coincided with an increase in positive perceptions of the economy.

Given the generally negative ratings of the economy today -- only 35% consider the economy "excellent" or "good," while 62% call it "only fair" or "poor" -- the economy certainly can't be helping the pro-immigrant cause recover from the damage that 9/11 did.
Close to Half the Public Thinks Immigrants Worsen Crime, Taxes
Another finding in the Minority Rights and Relations poll paints a more detailed picture of Americans' perceptions of immigrants, and suggests economics continues to be a factor in negative attitudes toward immigration.
Gallup asked respondents to rate the impact immigrants have on six different aspects of life in the United States. In all but one dimension, more Americans think that immigrants make the situation worse rather than better. This is especially true with respect to taxes and crime, on which close to half the public thinks immigrants make the situation worse. Immigrants are also viewed more negatively than positively in the areas of the overall economy, job opportunities, and social and moral values.
It is only with respect to "food, music, and the arts" that Americans are relatively positive: 44% of Americans believe immigrants make these aspects of the culture better, compared with 10% who believe immigrants make these worse -- yielding a "net positive" effect of +34 percentage points. (The remaining 42% say immigrants don't have much effect on this aspect of life in the United States.)
|
Effect of Immigrants on the United States |
||||
|
|
Better |
Not much effect |
Worse |
Net Effect |
|
|
% |
% |
% |
|
|
Food, music, and the arts |
44 |
42 |
10 |
+34 |
|
Social and moral values |
18 |
50 |
27 |
-9 |
|
The economy |
22 |
34 |
41 |
-19 |
|
Job opportunities |
11 |
51 |
37 |
-26 |
|
Taxes |
12 |
38 |
45 |
-33 |
|
Crime |
6 |
43 |
47 |
-41 |
The trend shows that negative perceptions on these dimensions are nothing new, although somewhat worse in 2002 and 2004 than they were in June 2001.
|
Net Positive Effect of Immigrants on the
United States |
|||
|
|
June 2001 |
June 2002 |
June 2004 |
|
Food, music, and the arts |
+50 |
+44 |
+34 |
|
Social and moral values |
-1 |
-5 |
-9 |
|
The economy |
0 |
-4 |
-19 |
|
Job opportunities for you/your family |
-16 |
-23 |
-26 |
|
Taxes |
-34 |
-38 |
-33 |
|
Crime |
-43 |
-42 |
-41 |
Survey Methods
Results are based on telephone interviews with 2,250 national adults, aged 18 and older, conducted June 9-30, 2004, including oversamples of blacks and Hispanics that are weighted to reflect their proportions in the general population. For results based on the total sample of national adults, one can say with 95% confidence that the maximum margin of sampling error is ±5 percentage points. In addition to sampling error, question wording and practical difficulties in conducting surveys can introduce error or bias into the findings of public opinion polls.
33. In your view, should immigration be kept at its present level, increased or decreased?
|
Present level |
Increased |
Decreased |
No opinion |
|
|
Total |
% |
% |
% |
% |
|
2004 Jun 9-30 |
33 |
14 |
49 |
4 |
|
2003 Jun 12-18 |
37 |
13 |
47 |
3 |
|
2002 Jun 3-9 |
36 |
12 |
49 |
3 |
|
2001 Jun 11-17 |
42 |
14 |
41 |
3 |
|
Non-Hispanic Whites |
||||
|
2004 Jun 9-30 |
34 |
13 |
51 |
2 |
|
2003 Jun 12-15 |
38 |
11 |
49 |
2 |
|
2002 Jun 3-6 |
36 |
9 |
52 |
3 |
|
2001 Jun 11-17 |
42 |
10 |
45 |
3 |
|
Blacks |
||||
|
2004 Jun 9-30 |
34 |
15 |
47 |
4 |
|
2003 Jun 12-18 |
33 |
20 |
44 |
3 |
|
2002 Jun 3-9 |
34 |
16 |
46 |
4 |
|
2001 Jun 11-17 |
42 |
24 |
31 |
3 |
|
Hispanics |
||||
|
2004 Jun 9-30 |
33 |
23 |
39 |
5 |
|
2003 Jun 12-18 |
35 |
24 |
36 |
5 |
|
2002 Jun 3-9 |
37 |
24 |
37 |
2 |
|
2001 Jun 11-17 |
38 |
33 |
25 |
4 |
NATIONAL ADULT TREND
|
Present level |
Increased |
Decreased |
No opinion |
|
|
% |
% |
% |
% |
|
|
2004 Jun 9-30 |
33 |
14 |
49 |
4 |
|
2003 Jun 12-18 |
37 |
13 |
47 |
3 |
|
2002 Sep 2-4 |
26 |
17 |
54 |
3 |
|
2002 Jun 3-9 |
36 |
12 |
49 |
3 |
|
2001 Oct 19-21 |
30 |
8 |
58 |
4 |
|
2001 Jun 11-17 |
42 |
14 |
41 |
3 |
|
2001 Mar 26-28 |
41 |
10 |
43 |
6 |
|
2000 Sep 11-13 |
41 |
13 |
38 |
8 |
|
1999 Feb 26-28 ^ |
41 |
10 |
44 |
5 |
|
1995 Jul 7-9 |
27 |
7 |
62 |
4 |
|
1995 Jun 5-6 |
24 |
7 |
65 |
4 |
|
1993 Jul 9-11 |
27 |
6 |
65 |
2 |
|
1986 Jun 19-23 † |
35 |
7 |
49 |
9 |
|
1977 Mar 25-28 |
37 |
7 |
42 |
14 |
|
1965 Jun 24-29 |
39 |
7 |
33 |
20 |
|
^ Based on 514 national adults; margin of error ± 5 PCT. PTS. |
||||
|
† CBS/New York Times poll. |
||||
34. For each of the following areas, please say whether immigrants to the United States are making the situation in the country better or worse, or not having much effect. How about -- [RANDOM ORDER]?
A. The crime situation
|
Better |
Worse |
Not much effect |
No opinion |
|
|
Total |
||||
|
2004 Jun 9-30 |
6 |
47 |
43 |
4 |
|
2002 Jun 3-9 |
8 |
50 |
37 |
5 |
|
2001 Jun 11-17 |
7 |
50 |
38 |
5 |
|
Non-Hispanic Whites |
||||
|
2004 Jun 9-30 |
4 |
49 |
45 |
2 |
|
2002 Jun 3-6 |
6 |
52 |
37 |
5 |
|
2001 Jun 11-17 |
5 |
54 |
37 |
4 |
|
Blacks |
||||
|
2004 Jun 9-30 |
5 |
44 |
45 |
6 |
|
2002 Jun 3-9 |
9 |
49 |
37 |
5 |
|
2001 Jun 11-17 |
9 |
44 |
41 |
6 |
|
Hispanics |
||||
|
2004 Jun 9-30 |
12 |
44 |
36 |
8 |
|
2002 Jun 3-9 |
18 |
41 |
34 |
7 |
|
2001 Jun 11-17 |
12 |
47 |
33 |
8 |
B. Job opportunities for you and your family
|
Better |
Worse |
Not much effect |
No opinion |
|
|
Total |
% |
% |
% |
% |
|
2004 Jun 9-30 |
11 |
37 |
51 |
1 |
|
2002 Jun 3-9 |
14 |
37 |
46 |
3 |
|
2001 Jun 11-17 |
15 |
31 |
50 |
4 |
|
Non-Hispanic Whites |
||||
|
2004 Jun 9-30 |
6 |
38 |
55 |
1 |
|
2002 Jun 3-6 |
10 |
37 |
50 |
3 |
|
2001 Jun 11-17 |
12 |
32 |
53 |
3 |
|
Blacks |
||||
|
2004 Jun 9-30 |
9 |
49 |
39 |
3 |
|
2002 Jun 3-9 |
14 |
48 |
36 |
2 |
|
2001 Jun 11-17 |
20 |
38 |
41 |
1 |
|
Hispanics |
||||
|
2004 Jun 9-30 |
34 |
28 |
36 |
2 |
|
2002 Jun 3-9 |
39 |
25 |
33 |
3 |
|
2001 Jun 11-17 |
42 |
18 |
37 |
3 |
Q.34 CONTINUED
C. Food, music, and the arts
|
Better |
Worse |
Not much effect |
No opinion |
|
|
Total |
% |
% |
% |
% |
|
2004 Jun 9-30 |
44 |
10 |
42 |
4 |
|
2002 Jun 3-9 |
54 |
10 |
31 |
5 |
|
2001 Jun 11-17 |
58 |
8 |
29 |
5 |
|
Non-Hispanic Whites |
||||
|
2004 Jun 9-30 |
42 |
11 |
43 |
4 |
|
2002 Jun 3-6 |
53 |
10 |
32 |
5 |
|
2001 Jun 11-17 |
59 |
8 |
28 |
5 |
|
Blacks |
||||
|
2004 Jun 9-30 |
29 |
12 |
56 |
3 |
|
2002 Jun 3-9 |
47 |
11 |
37 |
5 |
|
2001 Jun 11-17 |
54 |
10 |
33 |
3 |
|
Hispanics |
||||
|
2004 Jun 9-30 |
65 |
5 |
27 |
3 |
|
2002 Jun 3-9 |
69 |
5 |
21 |
5 |
|
2001 Jun 11-17 |
72 |
3 |
23 |
2 |
D. The economy in general
|
Better |
Worse |
Not much effect |
No opinion |
|
|
Total |
% |
% |
% |
% |
|
2004 Jun 9-30 |
22 |
41 |
34 |
3 |
|
2002 Jun 3-9 |
32 |
36 |
28 |
4 |
|
2001 Jun 11-17 |
32 |
32 |
31 |
5 |
|
Non-Hispanic Whites |
||||
|
2004 Jun 9-30 |
18 |
42 |
37 |
3 |
|
2002 Jun 3-6 |
29 |
37 |
30 |
4 |
|
2001 Jun 11-17 |
29 |
34 |
32 |
5 |
|
Blacks |
||||
|
2004 Jun 9-30 |
16 |
47 |
31 |
6 |
|
2002 Jun 3-9 |
25 |
47 |
24 |
4 |
|
2001 Jun 11-17 |
27 |
39 |
31 |
3 |
|
Hispanics |
||||
|
2004 Jun 9-30 |
48 |
29 |
20 |
3 |
|
2002 Jun 3-9 |
53 |
22 |
23 |
2 |
|
2001 Jun 11-17 |
42 |
23 |
29 |
6 |
Q.34 CONTINUED
E. Taxes
|
Better |
Worse |
Not much effect |
No opinion |
|
|
Total |
% |
% |
% |
% |
|
2004 Jun 9-30 |
12 |
45 |
38 |
5 |
|
2002 Jun 3-9 |
12 |
50 |
31 |
7 |
|
2001 Jun 11-17 |
12 |
46 |
34 |
8 |
|
Non-Hispanic Whites |
||||
|
2004 Jun 9-30 |
8 |
46 |
42 |
4 |
|
2002 Jun 3-6 |
9 |
52 |
32 |
7 |
|
2001 Jun 11-17 |
10 |
48 |
34 |
8 |
|
Blacks |
||||
|
2004 Jun 9-30 |
10 |
48 |
34 |
8 |
|
2002 Jun 3-9 |
14 |
54 |
25 |
7 |
|
2001 Jun 11-17 |
12 |
50 |
32 |
6 |
|
Hispanics |
||||
|
2004 Jun 9-30 |
34 |
34 |
25 |
7 |
|
2002 Jun 3-9 |
29 |
31 |
33 |
7 |
|
2001 Jun 11-17 |
40 |
26 |
25 |
9 |
F. Social and moral values
|
Better |
Worse |
Not much effect |
No opinion |
|
|
Total |
% |
% |
% |
% |
|
2004 Jun 9-30 |
18 |
27 |
50 |
5 |
|
2002 Jun 3-9 |
25 |
30 |
39 |
6 |
|
2001 Jun 11-17 |
25 |
26 |
45 |
4 |
|
Non-Hispanic Whites |
||||
|
2004 Jun 9-30 |
14 |
29 |
51 |
6 |
|
2002 Jun 3-6 |
22 |
32 |
41 |
5 |
|
2001 Jun 11-17 |
22 |
29 |
45 |
4 |
|
Blacks |
||||
|
2004 Jun 9-30 |
16 |
23 |
55 |
6 |
|
2002 Jun 3-9 |
27 |
31 |
34 |
8 |
|
2001 Jun 11-17 |
26 |
20 |
50 |
4 |
|
Hispanics |
||||
|
2004 Jun 9-30 |
38 |
21 |
37 |
4 |
|
2002 Jun 3-9 |
39 |
17 |
37 |
7 |
|
2001 Jun 11-17 |
45 |
17 |
34 |
4 |
SUMMARY TABLE: IMMIGRATION MAKING SITUATION "BETTER"
|
|
|
Non-Hispanic Whites |
|
|
|
% |
% |
% |
% |
|
|
Food, music, and the arts |
44 |
42 |
29 |
65 |
|
The economy in general |
22 |
18 |
16 |
48 |
|
Social and moral values |
18 |
14 |
16 |
38 |
|
Taxes |
12 |
8 |
10 |
34 |
|
Job opportunities for you and your family |
11 |
6 |
9 |
34 |
|
The crime situation |
6 |
4 |
5 |
12 |
