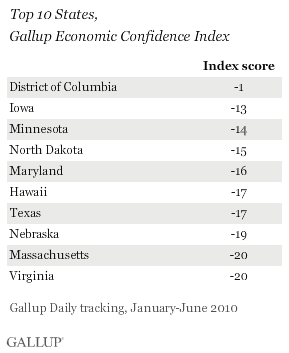
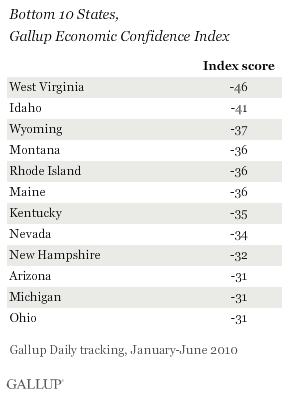
PRINCETON, NJ -- Americans as a whole remained more pessimistic than optimistic about the state of the U.S. economy in the first half of 2010, though residents of the District of Columbia, Iowa, Minnesota, and North Dakota were relatively more upbeat. West Virginians were the most negative about economic conditions during this time.


Gallup Daily tracking each day asks Americans to assess the current state of the U.S. economy and to say whether the economy is getting better or worse. The responses to these two questions are combined into Gallup's Economic Confidence Index, which has a theoretical range of -100 to +100. Negative scores indicate Americans are more pessimistic than optimistic about the state of the U.S. economy.
The average nationwide score in the first half of 2010 was -26, and each of the 50 states and the District of Columbia scored below zero during this time. (The index scores for each state and their ratings on each component item can be found on page 2.)

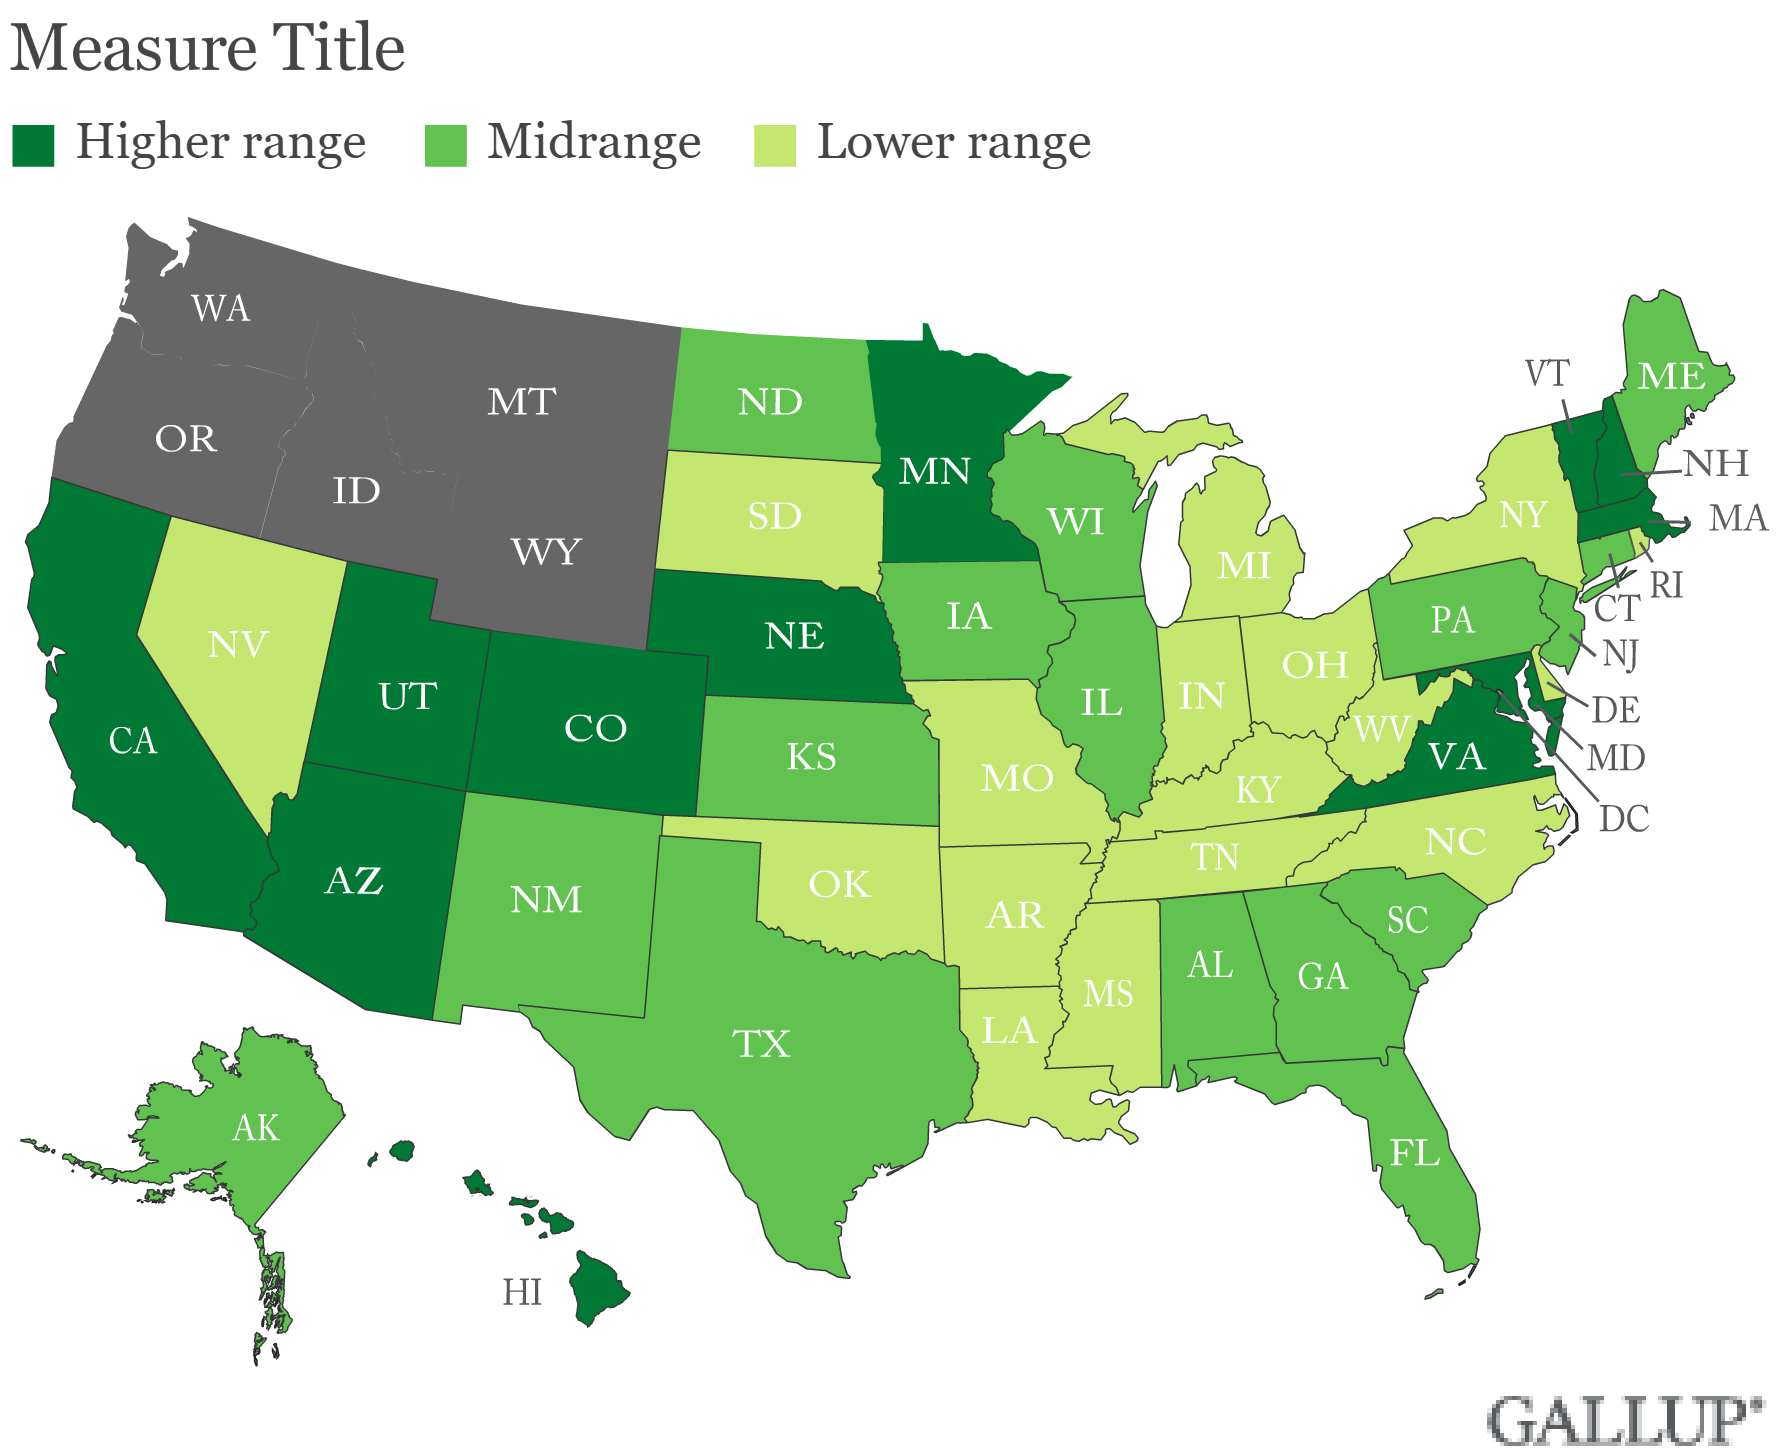
The states in the top and bottom 10 are regionally diverse. The Midwest claims 4 of the top 10 states, and 2 more plus the District of Columbia are in the Mid-Atlantic, but at least 1 state from each of the four major regions of the country is represented.
Five Mountain West states (Wyoming, Idaho, Nevada, Arizona, and Montana) and three New England states (Maine, New Hampshire, and Rhode Island) make up most of the least economically confident states, but again, at least one state from each of the four major regions ranks in the bottom 10.
Job Creation and Economic Confidence
Though Gallup's Economic Confidence Index items ask specifically about national economic conditions, local economic conditions surely color respondents' perceptions of the national economy. These include working Americans' observations of hiring activity at their places of business; thus, there is much overlap between the top- and bottom-ranking states on Gallup's Economic Confidence and Job Creation Indexes.
Five states and the District of Columbia ranked in the top 10 in the first half of this year for both job creation and economic confidence -- Iowa, North Dakota, Texas, Maryland, and Virginia. The higher job creation and economic confidence scores in the District of Columbia, Maryland, and Virginia likely reflect expanded federal government employment that has benefited residents in that area.
Seven states -- Idaho, Maine, Michigan, Nevada, New Hampshire, Rhode Island, and Wyoming -- ranked in the bottom 10 in both job creation and economic confidence.
Though the two ratings are related, there is more to how Americans rate the economy than just perceptions of the job market. This is apparent in the case of West Virginia, which is tied for eighth in job creation but ranks last in economic confidence. To some degree, the disconnect could be explained on the basis of politics, as West Virginia is one of the states least likely to have approved of the job Barack Obama did as president during the first half of this year, and economic confidence is influenced by one's political leanings.
Wyoming and Idaho also rank near the bottom in terms of both economic confidence and Obama job approval. Likewise, some of the states most likely to have approved of Obama in the first half of 2010 (Hawaii, Maryland, Massachusetts, and the District of Columbia) were also among the most economically confident states during this time.
Thus, states' economic confidence rankings reflect a mix of economic conditions and political leanings within each state.
This story is part of a series of midyear updates on Gallup's State of the States data, to be released in July and August on Gallup.com. See the complete schedule and send your suggestion for our "readers' pick." Gallup.com will report new full-year totals in early 2011 based on all 2010 surveys.
Survey Methods
Results are based on telephone interviews conducted as part of Gallup Daily tracking survey Jan. 2-June 30, 2010, with a random sample of 86,613 adults, aged 18 and older, living in all 50 U.S. states and the District of Columbia, selected using random-digit-dial sampling.
For results based on the total sample of national adults, one can say with 95% confidence that the maximum margin of sampling error is ±1 percentage point.
Margins of sampling error for individual states are higher. Most states have a margin of error of ±4 percentage points or less, though margins of error are as high as ±9 percentage points in the District of Columbia and ±8 percentage points in Wyoming, Hawaii, North Dakota and South Dakota.
Each state's data is weighted to ensure it is representative of that state's adult population on demographic characteristics.
Interviews are conducted with respondents on landline telephones and cellular phones, with interviews conducted in Spanish for respondents who are primarily Spanish-speaking. Each daily sample includes a minimum quota of 150 cell phone respondents and 850 landline respondents, with additional minimum quotas among landline respondents for gender within region. Landline respondents are chosen at random within each household on the basis of which member had the most recent birthday.
Samples are weighted by gender, age, race, Hispanic ethnicity, education, region, adults in the household, cell phone-only status, cell phone-mostly status, and phone lines. Demographic weighting targets are based on the March 2009 Current Population Survey figures for the aged 18 and older non-institutionalized population living in U.S. telephone households. All reported margins of sampling error include the computed design effects for weighting and sample design.
In addition to sampling error, question wording and practical difficulties in conducting surveys can introduce error or bias into the findings of public opinion polls.
For more details on Gallup's polling methodology, visit www.gallup.com.

