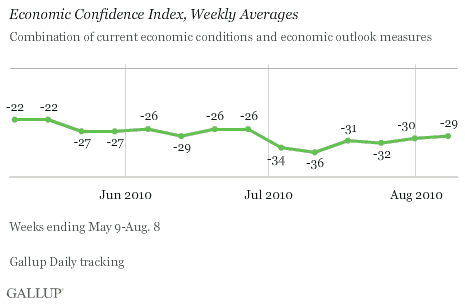
PRINCETON, NJ -- Gallup's Economic Confidence Index improved slightly in early August to -29 -- holding the improved perceptions of late July -- and is now four points better than the average for all of July (-33). The trend suggests Friday's Consumer Sentiment report is likely to show modest improvement as well.

Slightly Fewer Americans Rate U.S. Economy as "Poor"
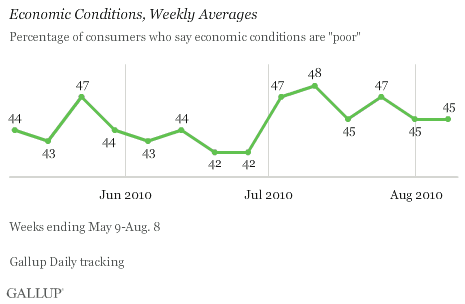
Part of the recent uptick in Gallup's Economic Confidence Index is the result of fewer Americans (45%) rating current economic conditions as "poor." Although that percentage is the same as the prior week's, it is marginally better than the full July average of 47%.

Slightly More Say Economy Is "Getting Better"
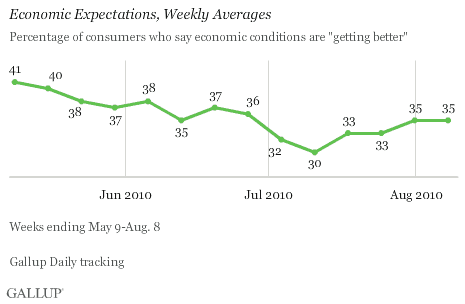
The Economic Confidence Index also improved during the past week because 35% of consumers told Gallup economic conditions are "getting better" in the country as a whole. This is up three points from the July average of 32%.

Analysis and Implications
Given that the stock market had its biggest gains in a year in July, and has held those gains during the first week of August, it may not be surprising that Gallup's Economic Confidence Index has shown modest improvement during late July and early August. Investor sentiment on Wall Street does tend to have at least a modest impact on Main Street consumer confidence.
However, it is becoming increasingly clear that while the success of many U.S. global enterprises may provide profits for U.S. investors, these may not translate into jobs for the many Americans looking for work. Many companies are hiring and investing in the growing emerging markets, not the slow-growth areas of the U.S. and Europe.
On the other hand, the drop in economic confidence of the past several months dating back to April likely reflects the so-called economic soft patch of recent months. As former Federal Reserve Chairman Alan Greenspan mentioned recently, such a slowdown in the midst of a modest economic recovery can feel a lot like a recession.
Probably of greatest concern in this regard are the fears of small-business owners who worry about their future revenues and cash flows. As a result, more of them expect to let go of workers than expect to hire workers over the next 12 months.
In sum, the Federal Open Market Committee faces some difficult issues when it meets Tuesday. As it deliberates, its members should keep in mind that higher equity prices reflect current consumer confidence. In turn, the most effective economic policy for a broad economic recovery might best be directed at improving things on Main Street as opposed to Wall Street.
Gallup.com reports results from these indexes in daily, weekly, and monthly averages and in Gallup.com stories. Complete trend data are always available to view and export in the following charts:
Daily: Employment, Economic Confidence and Job Creation, Consumer Spending
Weekly: Employment, Economic Confidence, Job Creation, Consumer Spending
Read more about Gallup's economic measures.
For Gallup Daily tracking, Gallup interviews approximately 1,000 national adults, aged 18 and older, each day. The Gallup economic confidence results are based on random half-samples of approximately 500 national adults, aged 18 and older, each day. Weekly results are based on telephone interviews with approximately 3,000 adults.
For these results, one can say with 95% confidence that the maximum margin of sampling error is ±3 percentage points.
Interviews are conducted with respondents on land-line telephones and cellular phones.
In addition to sampling error, question wording and practical difficulties in conducting surveys can introduce error or bias into the findings of public opinion polls.
Interviews are conducted with respondents on landline telephones and cellular phones, with interviews conducted in Spanish for respondents who are primarily Spanish-speaking. Each daily sample includes a minimum quota of 150 cell phone respondents and 850 landline respondents, with additional minimum quotas among landline respondents for gender within region. Landline respondents are chosen at random within each household on the basis of which member had the most recent birthday.
Samples are weighted by gender, age, race, Hispanic ethnicity, education, region, adults in the household, cell phone-only status, cell phone-mostly status, and phone lines. Demographic weighting targets are based on the March 2009 Current Population Survey figures for the aged 18 and older non-institutionalized population living in U.S. telephone households. All reported margins of sampling error include the computed design effects for weighting and sample design.
In addition to sampling error, question wording and practical difficulties in conducting surveys can introduce error or bias into the findings of public opinion polls.
For more details on Gallup's polling methodology, visit www.gallup.com.
