GALLUP NEWS SERVICE
PRINCETON, NJ -- Americans are more likely to turn to local television and newspapers for news and information than to national sources, according to a recent Gallup Poll. The only news source to show an increase in daily use from Gallup's 2002 poll on media usage is the Internet -- now at an all-time high. Use of public television news, nightly network news, local television news, and National Public Radio has decreased, and the number of Americans who report using nightly network news programs, local TV news, local newspapers, and network newsmagazine shows reached new lows in this year's poll.
Local Television News Used Most Often
Gallup's Dec. 5-8 poll asked Americans how often they get news from 10 different daily news sources and 3 weekly news sources. Local television news ranks at the top of the list of daily news sources, with 51% of Americans saying they use this source every day (and another 19% saying they use it several times a week). Next in line are local newspapers, with a 44% daily use rating; cable news networks, at 39%; and nightly network news programs, at 36%. In the middle of the list are morning programs on the national television networks and public television news, both mentioned by 27% of Americans. Adults are least likely to report using radio talk shows (21%), Internet sites (20%), National Public Radio (17%), and national newspapers like the New York Times or Wall Street Journal (7%).
|
How Often Do You Get Your News From the
Following Sources? |
||
|
|
Several |
|
|
% |
% |
|
|
Local television news from TV stations in your area |
51 |
19 |
|
Local newspapers in your area |
44 |
14 |
|
Cable news networks such as CNN, Fox News, and MSNBC |
39 |
16 |
|
Nightly network news programs on ABC, CBS, or NBC |
36 |
16 |
|
Morning news and interview programs on the national TV networks |
27 |
12 |
|
Public television news |
27 |
11 |
|
Radio talk shows |
21 |
12 |
|
News on the Internet |
20 |
6 |
|
National Public Radio |
17 |
12 |
|
National newspapers such as the New York Times |
7 |
4 |
Fewer than one in five Americans use any of the three weekly sources for their news on a regular basis. Nineteen percent of Americans watch television newsmagazine shows on a weekly basis, while 18% watch Sunday morning news programs and 11% read weekly newsmagazines every week.
|
How Often Do You Get Your News From the
Following Sources? |
||
|
|
Several |
|
|
% |
% |
|
|
TV newsmagazine shows during the evenings -- |
19 |
11 |
|
Television news programs on Sunday mornings |
18 |
7 |
|
Weekly newsmagazines |
11 |
4 |
Use of Internet for News Up
The Internet is the only news source in the poll that shows an increase in reported use this year, and more people now report using Internet sites than ever before for their news. When Gallup first asked about the use of the Internet for news in 1995, only 3% of Americans said they got their news on the Internet every day. These results increased to 7% in 1998, and held steady at 8% in 1999. By 2002, daily use of the Internet for news increased to 15%. This year, it increased to 20%. Still, it is important to note that use of the Internet for news continues to be dwarfed overall by use of traditional television and print news sources.
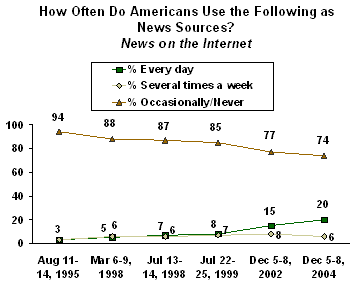
As the table below illustrates, there has been a decline over the last two years in the reported use of three different daily and weekly news sources: public television news (from 35% use "every day" in 2002 to 27% now); nightly network news (43% to 36%); and local television news (57% to 51%). NPR's drop of five points (22% to 17%) is only slightly higher than the margin of error, suggesting a decline. The other changes are all too small to be statistically significant, but in no case except the Internet was there an increase in reported use.
|
Daily News Sources percentage saying they use the news source "every day" |
|||
|
|
|
|
|
|
2002 |
2004 |
Change |
|
|
% |
% |
|
|
|
News on the Internet |
15 |
20 |
+5 |
|
Radio talk shows |
22 |
21 |
-1 |
|
Cable news networks such as CNN, Fox News, and MSNBC |
41 |
39 |
-2 |
|
Morning news/interview programs on the national TV networks |
29 |
27 |
-2 |
|
Local newspapers in your area |
47 |
44 |
-3 |
|
National newspapers such as the New York Times |
11 |
7 |
-4 |
|
National Public Radio |
22 |
17 |
-5 |
|
Local television news from TV stations in your area |
57 |
51 |
-6 |
|
Nightly network news programs on ABC, CBS, or NBC |
43 |
36 |
-7 |
|
Public television news |
35 |
27 |
-8 |
|
percentage saying they use the news source "every week" |
|||
|
|
|
|
|
|
2002 |
2004 |
Change |
|
|
% |
% |
|
|
|
Weekly newsmagazines |
12 |
11 |
-1 |
|
Television news programs on Sunday mornings |
18 |
18 |
0 |
|
TV newsmagazine shows during the evenings |
23 |
19 |
-4 |
For four news sources, this year's results show the lowest ratings that Gallup has recorded over the times these questions have been asked since 1995:
Nightly Network News Programs on ABC, CBS, or NBC
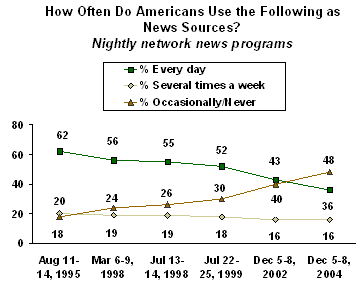
The percentage of Americans tuning into the nightly network news has shown a gradual decline since 1995, reaching an all-time low this year. In 1995, 62% of Americans said they turned to nightly network news shows on a daily basis. This percentage decreased to the low- to mid-50% range in the late 1990s. It then dropped to 43% in 2002, before falling seven points more this year.
Local Television News From TV Stations in Your Area
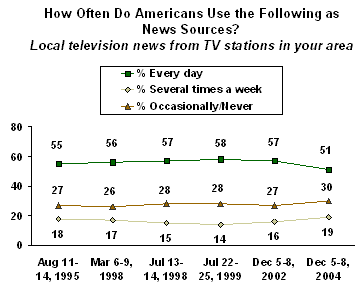
Use of local television news on a daily basis also hit a new low this year, at 51%. Previously, Gallup consistently found use of this news source to be in the mid- to upper-50% range.
Local Newspapers in Your Area
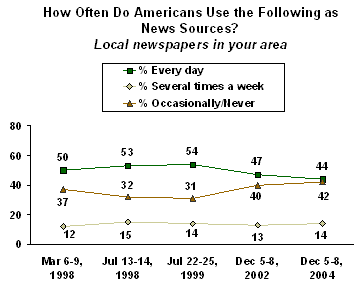
In March 1998, half of all Americans read local newspapers on a daily basis. This sentiment edged up to 53% in July 1998 and held steady at 54% in 1999. Daily use of local newspapers then began to decline, to 47% in 2002 and, again, to 44% this year.
TV Newsmagazine Shows During the Evenings ("60 Minutes," "20/20," "Dateline")
From 1995 through 1998, at least 3 in 10 Americans said they watched TV newsmagazine shows every week. This percentage dropped to 23% in 2002, and to 19% this year.
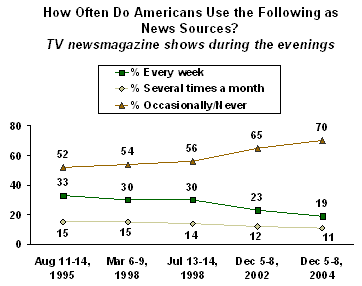
Even though many news sources show a decline in daily usage this year, three sources are still used more now than in the 1990s:
- The percentage using cable news networks every day averaged 24%
in four polls conducted from 1995 through 1999. Now, 39% say they
use cable news on a daily basis.
- Daily use of public television news, currently at 27%, is
higher than it was in both 1995 (23%) and 1998 (average of 18%),
but Americans report using it less frequently now than in 1999 and
2002.
- 2002 marked the high point for daily use of radio talk shows as news sources. This decreased only one point this year to 21% -- still considerably higher than the 12%, on average, who said radio talk shows were daily sources of news in 1995 through 1999 polls.
Older vs. Younger Americans
The current poll finds some interesting age differences in media usage:
- Americans aged 65 and older are more likely than people in any other age group to watch newsmagazine shows, watch Sunday morning news programs, or read weekly newsmagazines.
|
Weekly News Sources: percentage saying "every week" |
||||
|
|
|
|
65 years |
|
|
% |
% |
% |
% |
|
|
TV newsmagazine shows during the evenings |
11 |
14 |
19 |
37 |
|
Television news programs on Sunday mornings |
10 |
13 |
21 |
30 |
|
Weekly newsmagazines |
9 |
7 |
11 |
21 |
- Older Americans are also significantly more likely than people in any other age group to say they use the following news sources every day: local television news, nightly network news, local newspapers, cable news networks, public television news, and morning news and interview programs.
- Americans aged 65 and older are much less likely than those in any other age group to use the Internet for news on a daily basis.
- Americans between the ages of 30 and 64 are more likely than younger adults or senior citizens to use radio talk shows as news sources on a daily basis.
|
Daily News Sources: percentage saying "every day" |
||||
|
|
|
|
65 years |
|
|
% |
% |
% |
% |
|
|
Local television news from TV stations in your area |
33 |
50 |
51 |
70 |
|
Nightly network news programs on ABC, CBS, or NBC |
25 |
31 |
33 |
62 |
|
Local newspapers in your area |
32 |
35 |
52 |
61 |
|
Cable news networks such as CNN, Fox News, and MSNBC |
28 |
37 |
41 |
50 |
|
Public television news |
21 |
21 |
27 |
47 |
|
Morning news/interview programs on the national TV networks |
24 |
22 |
27 |
39 |
|
National Public Radio |
11 |
17 |
19 |
20 |
|
Radio talk shows |
18 |
23 |
24 |
15 |
|
National newspapers such as the New York Times |
3 |
7 |
8 |
8 |
|
News on the Internet |
21 |
26 |
19 |
7 |
Survey Methods
These results are based on telephone interviews with a randomly selected national sample of 1,003 adults, aged 18 and older, conducted Dec. 5-8, 2004. For results based on this sample, one can say with 95% confidence that the maximum error attributable to sampling and other random effects is ±3 percentage points. In addition to sampling error, question wording and practical difficulties in conducting surveys can introduce error or bias into the findings of public opinion polls.
22. Please indicate how often you get your news from each of the following sources -- every day, several times a week, occasionally, or never. How about -- [RANDOM ORDER]?
A. Local newspapers in your area
|
|
|
Several times |
|
|
|
|
% |
% |
% |
% |
% |
|
|
2004 Dec 5-8 |
44 |
14 |
27 |
15 |
* |
|
|
|
|
|
|
|
|
2002 Dec 5-8 |
47 |
13 |
26 |
14 |
* |
|
1999 Jul 22-25 |
54 |
14 |
21 |
10 |
1 |
|
1998 Jul 13-14 |
53 |
15 |
22 |
10 |
-- |
|
1998 Mar 6-9 ^ |
50 |
12 |
26 |
11 |
1 |
|
^ Asked of a half sample |
|||||
|
* Less than 0.5% |
|||||
B. National newspapers such as the New York Times, the Wall Street Journal, and USA Today
|
|
|
Several times |
|
|
|
|
% |
% |
% |
% |
% |
|
|
2002 Dec 5-8 |
7 |
4 |
27 |
62 |
* |
|
|
|
|
|
|
|
|
2002 Dec 5-8 |
11 |
5 |
26 |
58 |
-- |
|
1999 Jul 22-25 |
9 |
7 |
30 |
54 |
* |
|
1998 Jul 13-14 |
4 |
11 |
26 |
59 |
-- |
|
1998 Mar 6-9 ^ |
8 |
6 |
28 |
57 |
1 |
|
^ Asked of a half sample |
|||||
|
* Less than 0.5% |
|||||
C. Nightly network news programs on ABC, CBS, or NBC
|
|
Several times |
|
|
|
||
|
% |
% |
% |
% |
% |
||
|
2004 Dec 5-8 |
36 |
16 |
26 |
22 |
* |
|
|
|
|
|
|
|
||
|
2002 Dec 5-8 |
43 |
16 |
25 |
15 |
1 |
|
|
1999 Jul 22-25 |
52 |
18 |
22 |
8 |
-- |
|
|
1998 Jul 13-14 |
55 |
19 |
19 |
7 |
* |
|
|
1998 Mar 6-9 |
56 |
19 |
17 |
7 |
1 |
|
|
1995 Aug 11-14 |
62 |
20 |
15 |
3 |
* |
|
|
* Less than 0.5% |
||||||
D. Morning news and interview programs on the national TV networks
|
|
Several times |
|
|
|
||
|
% |
% |
% |
% |
% |
||
|
2004 Dec 5-8 |
27 |
12 |
25 |
36 |
* |
|
|
|
|
|
|
|
||
|
2002 Dec 5-8 |
29 |
10 |
26 |
34 |
1 |
|
|
1999 Jul 22-25 |
32 |
11 |
29 |
28 |
* |
|
|
1998 Jul 13-14 |
25 |
13 |
27 |
35 |
* |
|
|
1998 Mar 6-9 |
25 |
13 |
24 |
37 |
1 |
|
|
1995 Aug 11-14 |
23 |
13 |
34 |
30 |
-- |
|
|
* Less than 0.5% |
||||||
E. Cable news networks such as CNN, Fox News Channel, and MSNBC
|
|
Several times |
|
|
|
||
|
% |
% |
% |
% |
% |
||
|
2004 Dec 5-8 |
39 |
16 |
25 |
20 |
* |
|
|
|
|
|
|
|
||
|
2002 Dec 5-8 |
41 |
15 |
26 |
18 |
* |
|
|
1999 Jul 22-25 ^ |
29 |
22 |
32 |
17 |
* |
|
|
1998 Jul 13-14 ^ |
21 |
16 |
33 |
29 |
1 |
|
|
1998 Mar 6-9 ^ |
22 |
16 |
34 |
27 |
1 |
|
|
1995 Aug 11-14 ^ |
23 |
20 |
36 |
21 |
-- |
|
|
|
|
|
|
|
||
|
^ WORDING: CNN News or CNN Headline News |
||||||
|
* Less than 0.5% |
||||||
F. Public television news
|
|
Several times |
|
|
|
||
|
% |
% |
% |
% |
% |
||
|
2004 Dec 5-8 |
27 |
11 |
28 |
33 |
1 |
|
|
|
|
|
|
|
||
|
2002 Dec 5-8 |
35 |
12 |
29 |
24 |
* |
|
|
1999 Jul 22-25 |
30 |
12 |
33 |
24 |
1 |
|
|
1998 Jul 13-14 |
16 |
9 |
33 |
40 |
2 |
|
|
1998 Mar 6-9 |
19 |
10 |
32 |
37 |
2 |
|
|
1995 Aug 11-14 |
23 |
15 |
39 |
22 |
1 |
|
|
* Less than 0.5% |
||||||
G. Local television news from TV stations in your area
|
|
Several times |
|
|
|
||
|
% |
% |
% |
% |
% |
||
|
2004 Dec 5-8 |
51 |
19 |
19 |
11 |
* |
|
|
|
|
|
|
|
||
|
2002 Dec 5-8 |
57 |
16 |
18 |
9 |
* |
|
|
1999 Jul 22-25 |
58 |
14 |
19 |
9 |
* |
|
|
1998 Jul 13-14 |
57 |
15 |
19 |
9 |
* |
|
|
1998 Mar 6-9 |
56 |
17 |
17 |
9 |
1 |
|
|
1995 Aug 11-14 |
55 |
18 |
20 |
7 |
-- |
|
|
* Less than 0.5% |
||||||
H. National Public Radio
|
|
Several times |
|
|
|
||
|
% |
% |
% |
% |
% |
||
|
2004 Dec 5-8 |
17 |
12 |
25 |
46 |
* |
|
|
|
|
|
|
|
||
|
2002 Dec 5-8 |
22 |
9 |
28 |
40 |
1 |
|
|
1999 Jul 22-25 |
17 |
10 |
32 |
41 |
* |
|
|
1998 Jul 13-14 |
15 |
12 |
25 |
47 |
1 |
|
|
1998 Mar 6-9 |
20 |
10 |
26 |
43 |
1 |
|
|
1995 Aug 11-14 |
18 |
11 |
36 |
35 |
-- |
|
|
* Less than 0.5% |
||||||
I. Radio talk shows
|
|
Several times |
|
|
|
||
|
% |
% |
% |
% |
% |
||
|
2004 Dec 5-8 |
21 |
12 |
25 |
42 |
-- |
|
|
|
|
|
|
|
||
|
2002 Dec 5-8 |
22 |
10 |
29 |
39 |
* |
|
|
1999 Jul 22-25 |
12 |
8 |
33 |
47 |
* |
|
|
1998 Jul 13-14 |
12 |
9 |
21 |
58 |
* |
|
|
1998 Mar 6-9 |
11 |
5 |
25 |
58 |
1 |
|
|
1995 Aug 11-14 |
12 |
5 |
35 |
48 |
-- |
|
|
* Less than 0.5% |
||||||
J. News on the Internet
|
|
Several times |
|
|
|
||
|
% |
% |
% |
% |
% |
||
|
2004 Dec 5-8 |
20 |
6 |
25 |
49 |
* |
|
|
|
|
|
|
|
||
|
2002 Dec 5-8 |
15 |
8 |
27 |
50 |
* |
|
|
1999 Jul 22-25 ^ |
8 |
7 |
23 |
62 |
* |
|
|
1998 Jul 13-14 ^ |
7 |
6 |
17 |
70 |
* |
|
|
1998 Mar 6-9 ^ |
5 |
6 |
18 |
70 |
1 |
|
|
1995 Aug 11-14 ^ |
3 |
3 |
12 |
82 |
0 |
|
|
|
|
|
|
|
||
|
^ WORDING: News on the computer using the Internet or |
||||||
|
* Less than 0.5% |
||||||
23. And how often do you get your news from each of the following WEEKLY sources of news: every week, several times a month, occasionally, or never. How about -- [ITEMS READ IN ORDER]?
A. Weekly newsmagazines
|
|
Several times |
|
|
|
|
|
% |
% |
% |
% |
% |
|
|
2004 Dec 5-8 |
11 |
4 |
21 |
64 |
* |
|
2002 Dec 5-8 |
12 |
5 |
20 |
63 |
* |
|
1998 Jul 13-14 |
15 |
6 |
27 |
52 |
-- |
|
1998 Mar 6-9 |
13 |
6 |
26 |
54 |
1 |
|
1995 Aug 11-14 |
14 |
5 |
30 |
51 |
-- |
|
* Less than 0.5% |
|||||
B. Television news programs on Sunday mornings
|
|
Several times |
|
|
|
|
|
% |
% |
% |
% |
% |
|
|
2004 Dec 5-8 |
18 |
7 |
22 |
53 |
* |
|
|
|
|
|
|
|
|
2002 Dec 5-8 |
18 |
5 |
25 |
52 |
* |
|
1998 Jul 13-14 |
17 |
6 |
27 |
50 |
-- |
|
1998 Mar 6-9 |
18 |
5 |
27 |
49 |
1 |
|
1995 Aug 11-14 |
16 |
5 |
32 |
47 |
-- |
|
* Less than 0.5% |
|||||
C. TV newsmagazine shows during the evenings -- such as "60 Minutes," "20/20," "Dateline," and others
|
|
Several times |
|
|
|
|
|
% |
% |
% |
% |
% |
|
|
2004 Dec 5-8 |
19 |
11 |
44 |
26 |
* |
|
|
|
|
|
|
|
|
2002 Dec 5-8 |
23 |
12 |
45 |
20 |
-- |
|
1998 Jul 13-14 ^ |
30 |
14 |
42 |
14 |
* |
|
1998 Mar 6-9 ^ |
30 |
15 |
42 |
12 |
1 |
|
1995 Aug 11-14 ^ |
33 |
15 |
43 |
9 |
-- |
|
^ WORDING: TV newsmagazine shows during the evening, |
|||||
|
* Less than 0.5% |
|||||