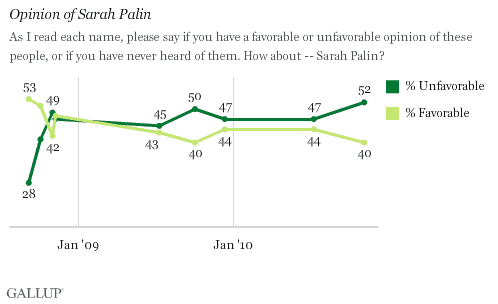
PRINCETON, NJ -- More than half of Americans, 52%, now view Sarah Palin unfavorably, the highest percentage holding a negative opinion of the former Alaska governor in Gallup polling since Sen. John McCain tapped her as the 2008 Republican vice presidential nominee. Her 40% favorable rating ties her lowest favorable score, recorded just over a year ago.

The latest results come from a Nov. 4-7 Gallup poll, conducted shortly after the midterm elections delivered some big wins as well as losses for Tea Party movement candidates Palin had actively campaigned for in the past year.
Palin's image has consistently tilted negative since July 2009, and was nearly as negative in October 2009 as it is today. Public views on her were also more negative than positive just before the 2008 election, in which President Obama handily defeated the Republican ticket. By contrast, Americans' initial reactions to Palin after her debut at the Republican National Convention that year were mostly favorable.
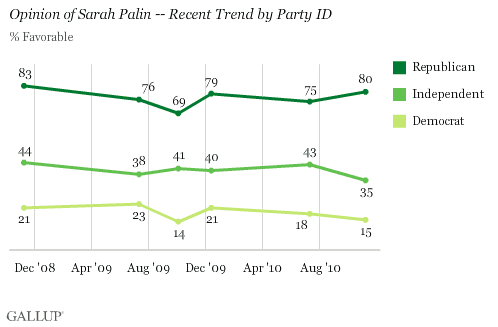
Now that the 2010 midterms are over, the big question swirling around Palin is whether she will run for the 2012 Republican presidential nomination. Given her high name recognition and broad popularity among Republicans, 80% of whom now view her favorably, she is clearly in a strong position to seek it. However, her negative image among the other party groups -- 81% of Democrats and 53% of independents view her unfavorably, while fewer than 4 in 10 view her favorably -- casts some doubt on her viability in the general election.

After Midterms, More Americans Take a Stance on the Tea Party
Although Palin is strongly associated with the national Tea Party movement, her decline in favorability is not mirrored in the post-election support Gallup finds for the Tea Party.
About a third of Americans, 32%, now consider themselves to be Tea Party supporters, up slightly from the 26% saying this before the election, and one percentage point higher than the previous high on this measure. At the same time, 30% of Americans consider themselves opponents of the movement, tying the prior high.

Nearly two-thirds of Republicans, 65%, call themselves supporters of the Tea Party movement in the latest poll, while 57% of Democrats are opponents of it. Independents are about evenly divided: 30% call themselves supporters and 25% say they are opponents.
Bottom Line
At the close of an eventful midterm election season that focused heavily on the Tea Party message and candidates, Americans remain broadly divided in their reactions to the Tea Party movement, while the majority now hold a negative image of Palin, one of the movement's most visible proponents. In the process, Palin maintained her already-positive image with Republicans while losing ground with independents and remaining widely unpopular with Democrats. The national Tea Party movement itself is also relatively polarizing, with about equal percentages of Americans calling themselves supporters and opponents.
Results for this Gallup poll are based on telephone interviews conducted Nov. 4-7, 2010, with a random sample of 1,021 adults, aged 18 and older, living in the continental U.S., selected using random-digit-dial sampling.
For results based on the total sample of national adults, one can say with 95% confidence that the maximum margin of sampling error is ±4 percentage points.
Interviews are conducted with respondents on landline telephones (for respondents with a landline telephone) and cellular phones (for respondents who are cell phone-only). Each sample includes a minimum quota of 150 cell phone-only respondents and 850 landline respondents, with additional minimum quotas among landline respondents for gender within region. Landline respondents are chosen at random within each household on the basis of which member had the most recent birthday.
Samples are weighted by gender, age, race, education, region, and phone lines. Demographic weighting targets are based on the March 2009 Current Population Survey figures for the aged 18 and older non-institutionalized population living in continental U.S. telephone households. All reported margins of sampling error include the computed design effects for weighting and sample design.
In addition to sampling error, question wording and practical difficulties in conducting surveys can introduce error or bias into the findings of public opinion polls.
View methodology, full question results, and trend data.
For more details on Gallup's polling methodology, visit https://www.gallup.com/.
