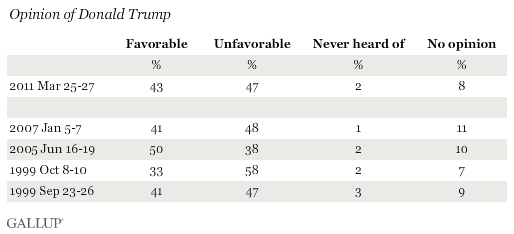
PRINCETON, NJ -- Americans have mixed opinions about businessman, television personality, and potential presidential candidate Donald Trump, with 43% saying their opinion is favorable and 47% holding an unfavorable opinion. Trump's public image is roughly the same now as it was in September 1999, just before the real estate mogul formed an exploratory committee to investigate the possibility of running for president on the Reform Party ticket.

Never one to shy away from an opportunity to be in the public eye, Trump has in recent weeks made a number of comments suggesting he might consider running for the GOP nomination in 2012. Observers are unsure of whether Trump has serious presidential ambitions, or is making an effort to increase his exposure and, hence, the ratings for his NBC television show "The Celebrity Apprentice." In a "Today" show interview April 7, Trump appeared to be serious, saying, "If I decide to run, I will do the best job. I will be best for this country."
Trump's interest in running for president in 1999 led to Gallup's first measurement of his image among the public, with results quite similar to those today. Gallup's most recent measure of Trump's image was in 2007, when he was publicly feuding with television personality Rosie O'Donnell. Americans' views of him then were also similar to their views today -- 41% had a favorable opinion, and 48% an unfavorable opinion.
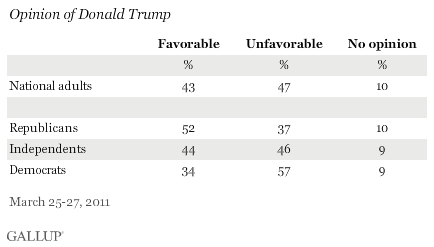
Republicans have somewhat more positive opinions of Trump than do independents, who essentially break even in their views. Democrats have more negative than positive views.

Republicans are more positive about Trump than they were four years ago, while Democrats are more negative. Trump's image was similar across partisan groups in January 2007, when his favorable rating was 43% among Republicans, and 40% among both independents and Democrats.
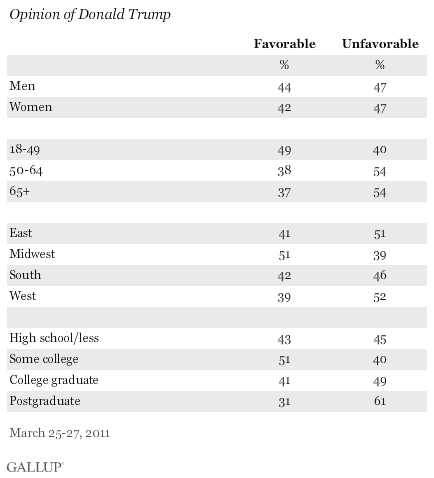
Trump is most liked by those living in the Midwest, those with some college education, and younger Americans. Men and women have almost identical views of Trump. Highly educated Americans, older Americans, and those living on both coasts are the most negative.

Implications
At this point, no one except perhaps Trump himself knows how serious he is about running for president. Although Trump has a more positive image among Republicans than among independents or in particular among Democrats, his 52% favorable rating among Republicans is relatively modest. The competitive field for 2012 is generally fairly open, however, given that no major candidate has formally declared that he or she is running, and there is no dominant front-runner.
Trump does enjoy what many candidates strive hard to develop -- 90% name recognition among all Americans and among Republicans. This generally makes him one of the most recognized potential GOP candidates Gallup tracks, in the same general territory as Sarah Palin, Mike Huckabee, Newt Gingrich, and Mitt Romney. Whether Trump could parlay that familiarity into voter support in primaries and caucuses is an open question.
A Wall Street Journal/NBC News poll released on Wednesday showed Trump does generate some support from Republicans. The poll found Trump essentially tied with Huckabee for second place behind Mitt Romney in a trial-heat test for the nomination among Republicans.
Trump has been critical of President Obama in recent weeks, particularly focusing on the "birther" issue of whether Obama was actually born in the United States. At this point, the president's image among Americans is more positive than Trump's. Fifty-four percent of Americans in the March 25-27 survey rate the president favorably, compared with the 43% who view Trump favorably.
Survey Methods
Results for this Gallup poll are based on telephone interviews conducted March 25-27, 2011, with a random sample of 1, 027 adults, aged 18 and older, living in the continental U.S., selected using random-digit-dial sampling.
For results based on the total sample of national adults, one can say with 95% confidence that the maximum margin of sampling error is ±4 percentage points.
Interviews are conducted with respondents on landline telephones (for respondents with a landline telephone) and cellular phones (for respondents who are cell phone-only). Each sample includes a minimum quota of 150 cell phone-only respondents and 850 landline respondents, with additional minimum quotas among landline respondents for gender within region. Landline respondents are chosen at random within each household on the basis of which member had the most recent birthday.
Samples are weighted by gender, age, race, education, region, and phone lines. Demographic weighting targets are based on the March 2010 Current Population Survey figures for the aged 18 and older non-institutionalized population living in continental U.S. telephone households. All reported margins of sampling error include the computed design effects for weighting and sample design.
In addition to sampling error, question wording and practical difficulties in conducting surveys can introduce error or bias into the findings of public opinion polls.
View methodology, full question results, and trend data.
For more details on Gallup's polling methodology, visit www.gallup.com.
