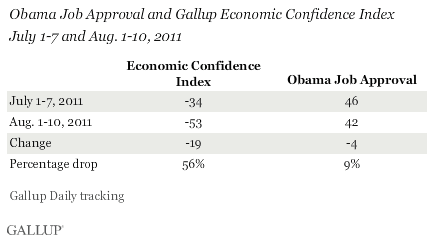
PRINCETON, NJ -- President Obama's job approval rating for the first 10 days of August is 4 percentage points lower than it was in the first week of July, significantly less of a drop than the 19-point decline in Gallup's Economic Confidence Index over the same period.

Presidents often get the credit or take the blame for economic conditions, and as a result a president's job approval rating can take a major hit when the economy sours. The wrangling in Washington over the debt ceiling in July and early August, coupled with Standard and Poor's downgrade of the U.S. credit rating and the major gyrations in the stock market, resulted in a significant plunge in Gallup's Economic Confidence Index in recent weeks. The Economic Confidence Index was at -34 for the first week in July, and has averaged -53 in the first 10 days of August.
President Obama's job approval rating drifted slightly downward over the same period of time, but not to nearly the same extent, from an average of 46% in the first week of July to an average of 42% in the first 10 days of August.
Overall, economic confidence showed a 56% decrease over this time period, while Obama's approval rating dropped 9%.
The accompanying graph displays Gallup's Economic Confidence Index and Obama's job approval rating on an indexed basis for July 1 through August 10. Both of these measures are indexed to their average during this time period, such that scores above 100 indicate a higher than average score, and below 100 a lower than average score.

These trends show that economic confidence has dropped to a significantly greater extent over this July 1-Aug. 10 time period than has Obama's job approval rating.
Implications
Changes in a president's job approval rating reflect a number of different factors, both domestic and international. Over the course of his presidency, changes in Obama's job approval ratings have not always been highly correlated with changes in economic confidence -- in part because he came into office with high approval ratings at a time when economic confidence was even lower than it is now.
But there is little doubt that a president's job approval rating often reflects Americans' views of the economy. The job approval ratings of Presidents George H.W. Bush and Carter dropped into the 20% range in the later part of their first and only terms as a result of bad economies, and of course, both lost their bids for re-election. Bill Clinton maintained high approval ratings even while embroiled in the Monica Lewinsky scandal, in part due to the surging economy.
So far, President Obama's job approval rating has on a relative basis held its own amid the recent string of economic and political events -- dropping 4 points when comparing his weekly average at the beginning of July to his average for the first 10 days of August, substantially less severe than the drop in Gallup's Economic Confidence Index over the same time period.
Explore President Obama's approval ratings in depth and compare them with those of past presidents in the Gallup Presidential Job Approval Center.
Survey Methods
Results are based on telephone interviews conducted as part of Gallup Daily tracking July 1-7 and Aug. 1-10, 2011, with weekly samples of random sample of approximately 3,100 and 3,500 adults, respectively, aged 18 and older, living in all 50 U.S. states and the District of Columbia.
For results based on any weekly samples of national adults, one can say with 95% confidence that the maximum margin of sampling error is ±3 percentage points. For the three-day rolling average samples used for the indexed comparison graph included in this analysis, one can say with 95% confidence that the maximum margin of sampling error is ±4 percentage points.
Interviews are conducted with respondents on landline telephones and cellular phones, with interviews conducted in Spanish for respondents who are primarily Spanish-speaking. Each sample includes a minimum quota of 400 cell phone respondents and 600 landline respondents per 1,000 national adults, with additional minimum quotas among landline respondents by region. Landline telephone numbers are chosen at random among listed telephone numbers. Cell phone numbers are selected using random-digit-dial methods. Landline respondents are chosen at random within each household on the basis of which member had the most recent birthday.
Samples are weighted by gender, age, race, Hispanic ethnicity, education, region, adults in the household, and phone status (cell phone only/landline only/both, cell phone mostly, and having an unlisted landline number). Demographic weighting targets are based on the March 2010 Current Population Survey figures for the aged 18 and older non-institutionalized population living in U.S. telephone households. All reported margins of sampling error include the computed design effects for weighting and sample design.
In addition to sampling error, question wording and practical difficulties in conducting surveys can introduce error or bias into the findings of public opinion polls.
For more details on Gallup's polling methodology, visit www.gallup.com.
