PRINCETON, NJ -- Americans would still prefer to work for a male (32%) rather than a female (22%) boss if they were taking a new job, but the edge for a male boss is now, by two percentage points, the smallest it has been since Gallup first began asking this question in 1953. Almost half now say gender would make no difference in their preference.
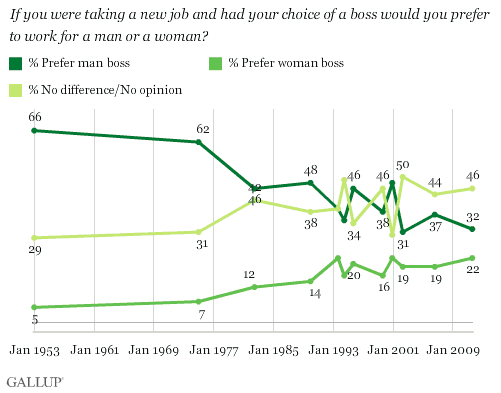
When Gallup first asked about preferences for a male or female boss in 1953, 66% of Americans said they preferred a man, while 5% said they preferred a woman. About 6 in 10 preferred a male boss when Gallup next asked the question in 1975, but by the 1980s preferences for a male boss had slipped below 50%.
The percentages of Americans preferring a male boss and those with no preference moved around quite a bit in the 1990s and 2000s, but in the three most recent administrations of the question, in 2002, 2006, and 2011, the plurality of Americans have volunteered that they would have no preference for the gender of their boss if taking a new job. The gap between preferences for a male or a female boss has shifted from survey to survey in recent years as well, ranging from a 26-point male boss preference in 2000 to a 10-point preference in the most recent survey -- the narrowest to date.
This question has traditionally been asked of all Americans, regardless of their employment status or work history; the responses of employed Americans in the most recent survey are virtually identical to those who are not employed.
Gender of Current Boss Appears to Affect Preferences
Gallup also asked U.S. workers to say whether their current boss was a man or a woman; 56% report having a male boss, while 30% have a female boss and another 13% say they don't have a boss. The gender of one's current boss appears to be significantly related to preferences for the gender of one's boss. Working Americans who currently have a male boss prefer a male boss by a 23-point margin, while the smaller number who currently have a female boss say they would prefer to have a female boss if they had a choice -- by a 9-point margin.
The precise explanation for this relationship is not clear. It is possible that certain types of workers who have pre-existing preferences for a female boss are more likely to end up in situations that match their preferences, or it is possible that the experience of working under a female boss may affect workers' attitudes.
Women More Likely to Have an Opinion, But Prefer a Male Boss, As Do Men
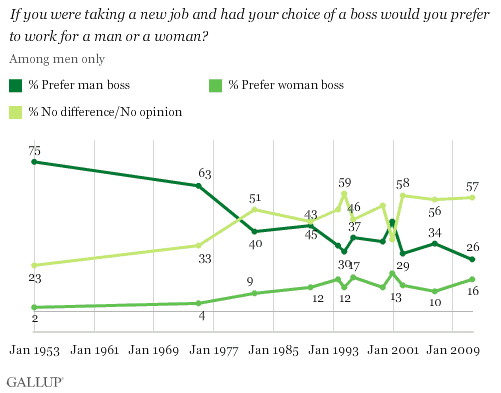
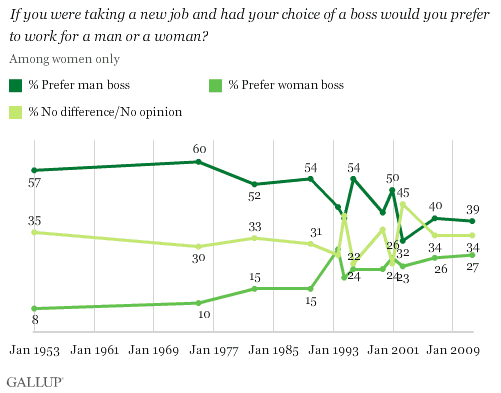
Although one might hypothesize that men would prefer a male boss and women a female boss, this does not appear to be the case. Instead, the results from the latest Aug. 11-14 survey show that the major difference between sexes is in terms of having a preference at all, rather than in terms of the preferred gender of one's boss.
The majority of men express no preference regarding the gender of their boss, while women are both more likely than men to say they would prefer having a male and a female boss. Still, both men and women end up preferring a male boss -- men by 26% to 16%, and women by 39% to 27%.
Age Makes Big Difference in Preferences Among Women, But Not Among Men
Americans younger than 50 tilt only slightly toward a preference for a male boss rather than a female boss (31% vs. 27%), while those 50 and older are significantly more likely to say they prefer a male (35% vs. 16%).
There is an important interaction between age and gender in terms of boss gender preference. Women younger than 50 are virtually even in their preferences, with a slight two-point tilt toward a desire for a female boss. Women 50 and older are substantially more likely to prefer a male boss, 44% vs. 18%. There is little difference in the preferences of men, regardless of their age.
Implications
Male bosses still dominate in the American workplace today, and Americans continue to have a slight preference for a male versus a female boss if they were to take a new job. Almost half of Americans, however, don't have a preference, and the edge for a male versus a female boss is now, by two points, the smallest it has been since Gallup first began asking this question in 1953.
The fact that younger Americans are about equal in their preferences for a male or a female boss suggests that these overall preferences may change as the population ages in the years ahead. The biggest potential for change appears to be among women, since younger women are as likely to prefer a female as a male boss if given a choice, while older women are quite strong in their preferences for a male boss.
Survey Methods
Results for this Gallup poll are based on telephone interviews conducted Aug. 11-14, 2011, with a random sample of 1,008 adults, aged 18 and older, living in the continental U.S. selected using random digit dial sampling.
For results based on the total sample of national adult, one can say with 95% confidence that the maximum margin of sampling error is ±4 percentage points.
Interviews are conducted with respondents on landline telephones and cellular phones, with interviews conducted in Spanish for respondents who are primarily Spanish-speaking. Each sample includes a minimum quota of 400 cell phone respondents and 600 landline respondents per 1,000 national adults, with additional minimum quotas among landline respondents for gender within region. Landline telephone numbers are chosen at random among listed telephone numbers. Cell phones numbers are selected using random digit dial methods. Landline respondents are chosen at random within each household on the basis of which member had the most recent birthday.
Samples are weighted by gender, age, race, Hispanic ethnicity, education, region, adults in the household, and phone status (cell phone-only/landline only/both, cell phone mostly, and having an unlisted landline number). Demographic weighting targets are based on the March 2010 Current Population Survey figures for the aged 18 and older non-institutionalized population living in U.S. telephone households. All reported margins of sampling error include the computed design effects for weighting and sample design.
In addition to sampling error, question wording and practical difficulties in conducting surveys can introduce error or bias into the findings of public opinion polls.
View methodology, full question results, and trend data.
For more details on Gallup's polling methodology, visit https://www.gallup.com/.
