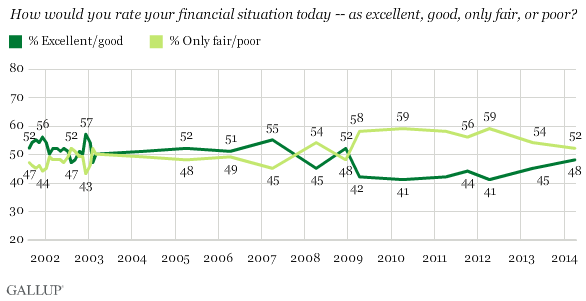
PRINCETON, NJ -- The number of Americans who rate their financial situations as "excellent" or "good" has rebounded to 48%, up from the lows of 41% reached in 2010 and 2012. A slim majority (52%) continue to rate their personal situation as "only fair" or "poor," though this is down from a high of 59%. These sentiments are the most positive they have been since 2008.

The percentage of Americans who rate their finances as only fair or poor shot up in 2009 and has remained higher than those who rate their finances positively in the years since, although there has been significant movement in the positive direction in the last two years. The most positive point on this trend came in 2002, when 57% rated their personal finances as excellent or good.
The most recent data are from Gallup's April 3-6 Economy and Personal Finance survey.
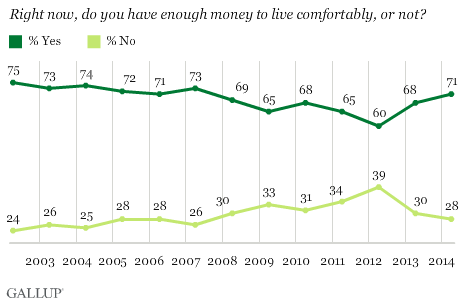
Another measure of Americans' personal finances has shown a positive uptick over the last two years. Seventy-one percent of Americans now say they have enough money to live comfortably, while 28% say they do not. Over the last 12 years, the majority of Americans have consistently said that they have enough money to live comfortably, but that percentage fell to as low as 60% in 2012.

One in Four Living With Challenging Financial Situation
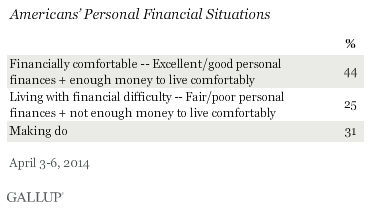
Despite the increase in Americans' positive financial perceptions, a significant segment of the population views themselves as having financial difficulties. About one in four Americans can be classified today as living with "challenging" financial situations they rate their personal financial situations as only fair or poor and say they do not have enough money to live comfortably. On the other hand, four in 10 are financially comfortable, rating their financial situation as excellent or good and saying they have enough money to live comfortably, with the rest somewhere in the middle.

Bottom Line
Americans overall remain more likely to say their personal finances are only fair or poor than to rate them as excellent or good, although this negative gap has been closing over the last two years. Similarly, Americans are slightly less likely now than they were two years ago to say they don't have enough money to live comfortably. Still, about a quarter of Americans today can be classified as living with challenging financial situations, meaning they claim not to have enough money to live comfortably and at the same time rate their personal finances as only fair or poor.
The broad topic of inequality in American society has become a focus of much political and policy discussion in recent years. Various approaches to instituting changes in the situation have been proposed, but while the American public opinion solidly favors such things as an increase in the minimum wage and higher taxes on the wealthy, it is not clear how much of a change these policies would make in the broad picture on inequality. At any rate, Gallup's trend measures suggest that Americans' perceptions of negativity when it comes to their own financial situations have been decreasing in recent years, perhaps suggesting that the issue of inequality could be becoming less salient. Still, it is clear that one out of four Americans at this time would most likely welcome programs or policies that might help them ease the pressure of their financial squeeze.
Survey Methods
Results for this Gallup poll are based on telephone interviews conducted April 3-6, 2014, on the Gallup Daily tracking survey, with a random sample of 1,026 adults, aged 18 and older, living in all 50 U.S. states and the District of Columbia.
For results based on the total sample of national adults, the margin of sampling error is ±4 percentage points at the 95% confidence level.
Interviews are conducted with respondents on landline telephones and cellular phones, with interviews conducted in Spanish for respondents who are primarily Spanish-speaking. Each sample of national adults includes a minimum quota of 50% cellphone respondents and 50% landline respondents, with additional minimum quotas by time zone within region. Landline and cellular telephone numbers are selected using random-digit-dial methods. Landline respondents are chosen at random within each household on the basis of which member had the most recent birthday.
Samples are weighted to correct for unequal selection probability, nonresponse, and double coverage of landline and cell users in the two sampling frames. They are also weighted to match the national demographics of gender, age, race, Hispanic ethnicity, education, region, population density, and phone status (cellphone only/landline only/both, and cellphone mostly). Demographic weighting targets are based on the most recent Current Population Survey figures for the aged 18 and older U.S. population. Phone status targets are based on the most recent National Health Interview Survey. Population density targets are based on the most recent U.S. census. All reported margins of sampling error include the computed design effects for weighting.
In addition to sampling error, question wording and practical difficulties in conducting surveys can introduce error or bias into the findings of public opinion polls.
View methodology, complete question responses, and trends.
For more details on Gallup's polling methodology, visit www.gallup.com.
