GALLUP NEWS SERVICE
PRINCETON, NJ -- If you find you are not in the best mood while reading this article, it may be because you are doing so on Americans' least favorite day of the week, on the last day of the most popular season. A recent Gallup Poll finds that more Americans pick spring as their favorite season and Monday as their least favorite day of the week. Americans clearly prefer Friday and the weekend days to the other days of the week, with Friday a slight overall favorite. There is no consensus in terms of the public's favorite month, with May, June, October, and December most frequently mentioned. A majority of Americans also say they are a "morning person" rather than a "night person."
Seasons
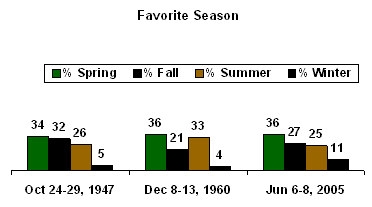
The June 6-8 Gallup Poll finds 36% of Americans naming spring as
their favorite season of the year, while 27% prefer fall, 25%
summer, and just 11% winter. Each time Gallup has asked the
question -- in 1947, 1960, and this year -- spring is the season
the public has been most likely to name as its favorite.
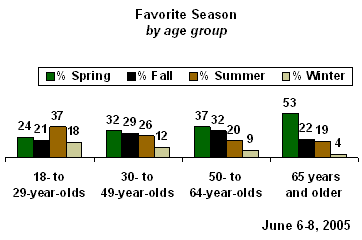
Favorite seasons differ by age group. For example, Americans aged 18 to 29 are the group least likely to prefer spring (24%), while those 65 and older are most likely to prefer it (53%). Younger Americans are much more likely to prefer summer than are those in older age groups, and, in fact, summer is the top choice among this age group. That could be because many in this age group are students or recently were students, and summer meant a break from classes. Younger Americans are also the age group most likely to say winter is their favorite season.
Months
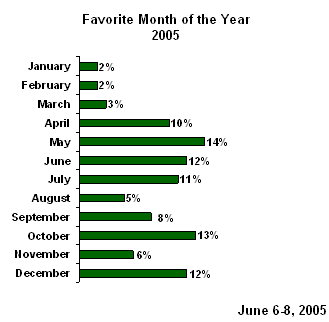
The poll shows a lack of consensus when Americans are asked to name their favorite month. Fourteen percent say May, 13% October, 12% June, and 12% December. The months mentioned least often are January, February, and March.
Gallup asked this question previously in 1960, at which time May and June were the favorites, mentioned by 19% and 18%, respectively.
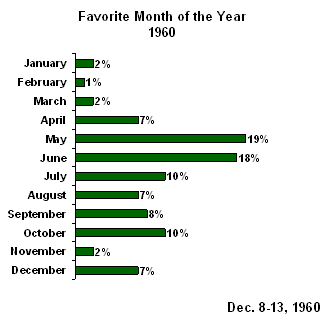
It is unclear whether there might be a seasonal effect in responses to this question, because the 1960 poll was conducted in December and the current poll in June. In 1960, more chose May and June than did so this year, and more now choose November and December than did so then.
Days of the Week
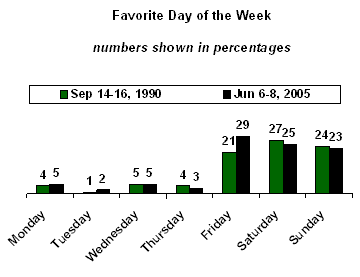
Americans clearly prefer Friday and the weekend days to the beginning of the work week -- more than three in four say Friday (29%), Saturday (25%), or Sunday (23%) is their favorite day of the week. That is consistent with data on this question from 1990, though in that poll, Saturday (27%) had a slight edge over Sunday (24%) and Friday (21%).
There are differences in favorite day of the week by age. Those in younger age groups are more likely to peg Friday as their favorite day, while those in older age groups are more likely to choose Sunday.
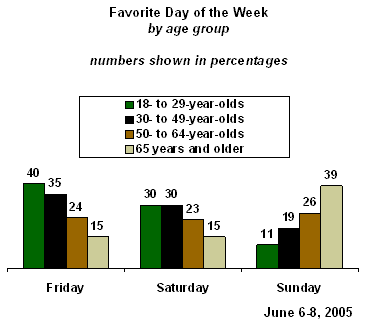
Older Americans' preference for Sunday is largely driven by the fact that older women favor that day. Among women aged 50 and older, 38% say Sunday is their favorite, 16% Saturday, and 17% Friday. Men aged 50 and older are about equally likely to choose Friday (25%), Saturday (23%), or Sunday (23%) as their favorite. Older women's preference for Sunday could be related to their tendency to be more religious than other age and gender groups, and less likely to be employed.
Gallup also asked Americans to name their least favorite day of the week. Monday is the overwhelming choice, mentioned by 65% of Americans. All other days are in the single digits.
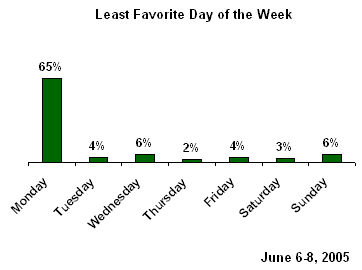
Monday was also the least favorite day when Gallup asked the question in 1990, but now slightly more Americans choose it than did so then (65% compared with 59%).
The data show that Americans' disdain for Monday apparently fades as they grow older and stop working. Seventy-five percent of 18- to 29-year-olds, 72% of 30- to 49-year-olds, 59% of 50- to 64-year-olds, and 49% of those 65 and older say Monday is their least favorite day. Despite the drop among the oldest age group, Monday still is this group's least favorite day; the difference is attributable to the fact that 22% of those 65 and older volunteer that they do not dislike any day in particular. Similarly, 70% of working Americans rate Monday as their least favorite day, compared with 59% of non-working Americans.
Time of Day
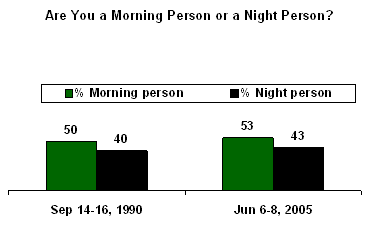
To get a sense of the public's preferred time of day, Gallup asked Americans if they considered themselves a "morning person" or a "night person." A majority, 53%, say they are morning people, while 43% say they are at their best at night. Those results are similar to what Gallup found in 1990, when 50% said they were morning people and 40% night people.
Americans in most age groups say they are morning people. One dramatic exception occurs among young adults -- by a 70% to 29% margin, 18- to 29-year-olds say they are night people. In all other age groups, at least a slim majority say they are morning people.
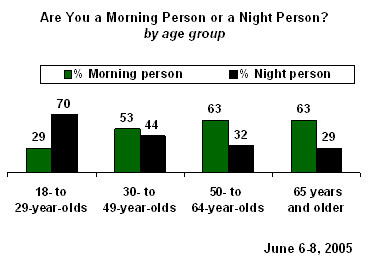
The results also differ by race: 57% of whites say they are morning people, while 39% say they are night people; among nonwhites, 59% say they are night people and 37% morning people.
Survey Methods
These results are based on telephone interviews with a randomly selected national sample of 1,002 adults, aged 18 and older, conducted June 6-8, 2005. For results based on this sample, one can say with 95% confidence that the maximum error attributable to sampling and other random effects is ±3 percentage points. In addition to sampling error, question wording and practical difficulties in conducting surveys can introduce error or bias into the findings of public opinion polls.
On a different topic,
16. What is your favorite season of the year? [OPEN-ENDED]
|
|
Spring |
Fall |
Summer |
Winter |
No opinion |
|
% |
% |
% |
% |
% |
|
|
2005 Jun 6-8 |
36 |
27 |
25 |
11 |
1 |
|
|
|
|
|
|
|
|
1960 Dec 8-13 |
36 |
21 |
33 |
4 |
6 |
|
1947 Oct 24-29 |
34 |
32 |
26 |
5 |
3 |
17. What is your favorite month of the year? [OPEN-ENDED]
|
|
2005 Jun 6-8 |
1960 Dec 8-13 |
|
% |
% |
|
|
January |
2 |
2 |
|
February |
2 |
1 |
|
March |
3 |
2 |
|
April |
10 |
7 |
|
May |
14 |
19 |
|
June |
12 |
18 |
|
July |
11 |
10 |
|
August |
5 |
7 |
|
September |
8 |
8 |
|
October |
13 |
10 |
|
November |
6 |
2 |
|
December |
12 |
7 |
|
|
|
|
|
No opinion |
2 |
7 |
18. Do you consider yourself a morning person or a night person -- that is, are you at your best in the morning or at night?
|
|
Morning |
Night |
NEITHER |
No opinion |
|
|
|
|
|
|
|
2005 Jun 6-8 |
53% |
43 |
3 |
1 |
|
|
|
|
|
|
|
1990 Sep 14-16 |
50% |
40 |
8 |
2 |
|
(vol.) = Volunteered response |
||||
19. What is your favorite day of the week? [OPEN-ENDED]
|
|
2005 Jun 6-8 |
1990 Sep 14-16 |
|
% |
% |
|
|
Monday |
5 |
4 |
|
Tuesday |
2 |
1 |
|
Wednesday |
5 |
5 |
|
Thursday |
3 |
4 |
|
Friday |
29 |
21 |
|
Saturday |
25 |
27 |
|
Sunday |
23 |
24 |
|
|
|
|
|
Like them all |
2 |
4 |
|
No particular favorite/none |
5 |
9 |
|
|
|
|
|
No opinion |
1 |
* |
|
* Less than 0.5% |
||
20. What is your least favorite day of the week? [OPEN-ENDED]
|
|
2005 Jun 6-8 |
1990 Sep 14-16 |
|
% |
% |
|
|
Monday |
65 |
59 |
|
Tuesday |
4 |
2 |
|
Wednesday |
6 |
5 |
|
Thursday |
2 |
2 |
|
Friday |
4 |
3 |
|
Saturday |
3 |
4 |
|
Sunday |
6 |
7 |
|
|
|
|
|
Dislike them all |
* |
3 |
|
None in particular favorite/none |
9 |
14 |
|
|
|
|
|
No opinion |
1 |
1 |
|
* Less than 0.5% |
||