GALLUP NEWS SERVICE
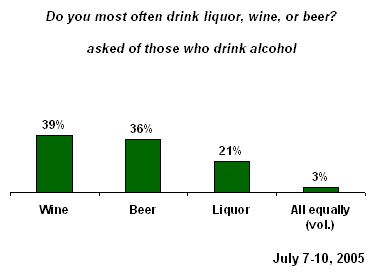
PRINCETON, NJ -- For the first time in Gallup's measurement of Americans' drinking preferences, there is a statistical tie between wine and beer as the alcoholic beverage adult drinkers say they drink most often. As recently as last year, beer edged out wine as Americans' standard drink. Today, 39% of drinkers in the United States say they drink wine most often, while 36% say they usually drink beer. This is according to Gallup's annual Consumption Habits poll, conducted July 7-10, 2005.
Overall, 63% of Americans say they drink alcohol, which is consistent with the rate of drinking recorded for most of the six decades Gallup has asked this question. The major exception is the period from 1976 through 1981, when 69%-71% said they drank alcohol.
Most of the latest change in Americans' preference for type of drink is seen in the percentage naming wine, up six points from 33% in 2004. This is the first significant shift in wine preferences recorded in the last eight years.
When Gallup asked Americans about their drinking preferences in 1992, beer was the runaway leader, with 47% naming it; just 27% named wine. Liquor has consistently ranked third, with between 18% and 24% naming it as their preferred drink.
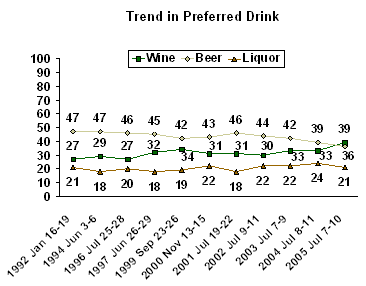
Given the overall trends, one might assume that beer drinkers have merely switched over to wine. But a close review of the data suggests a more complicated pattern of changes in alcohol consumption since 1992. With one demographic group, beer drinking is giving way to liquor, while among another, beer is losing ground to wine; with still another, the preference for liquor is declining while wine is gaining.
The net result is a decrease in the percentage of drinkers naming beer as their standard drink (from 47% in 1992 to 36% today) and a commensurate increase in wine drinkers (from 27% to 39%), with no change in those preferring liquor (21%).
In Search of a Keg Party
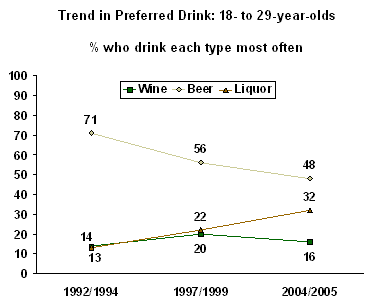
One of the biggest trends Gallup sees in drinking patterns over the past decade is a crumbling of the once-dominant positioning of beer among young adults.
It appears that young adults are trading in their beer mugs for martini glasses, in droves. Beer is still the preferred drink of nearly half of adults aged 18-29*, but the figure is down compared with 10 -- and even 5 -- years ago. In contrast, the percentage saying they usually drink liquor has more than doubled, from 13% to 32%.
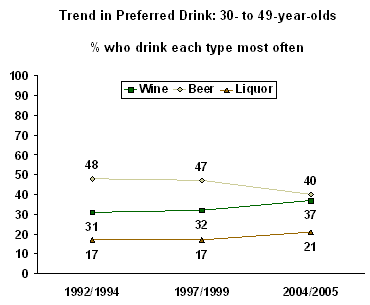
Beer is also losing ground among middle-aged Americans. The percentage of those 30-49 who most often drink beer has declined from 48% in the early '90s to 40% in the last two years. Both liquor and wine have made corresponding gains among this age segment as a result.
The percentage of beer drinkers among older Americans -- those 50 and older -- appears stable at around 30%. Wine has consistently been the top drink preferred by this age category, although since 1994, the percentage choosing wine has increased further (from 37% to 45%), while the percentage for liquor has declined (from 30% to 20%).
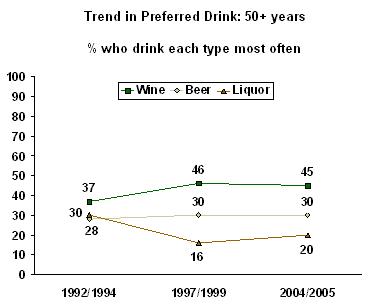
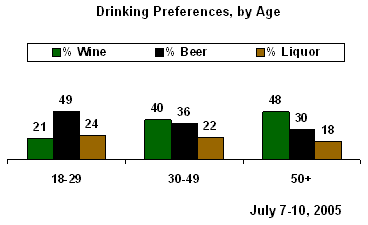
Despite the downward trend in the percentage of young adults whose preferred drink is beer, it remains their top choice as of Gallup's July 2005 survey. Wine and beer are closely matched as the preferred drink of those 30-49, while wine is the clear leader among those 50 and older.
The Gender Gap in Drinking
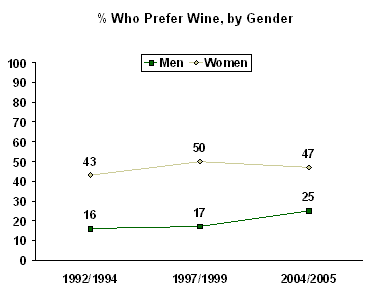
Men prefer beer; women prefer wine. That has been the case throughout Gallup's tracking of this measure. Even in 1992, when beer was chosen by nearly 2-to-1 over wine among all drinkers, only 27% of women named beer as their standard drink, while 43% named wine. Since then, wine has gained in popularity among both sexes, but especially among men.
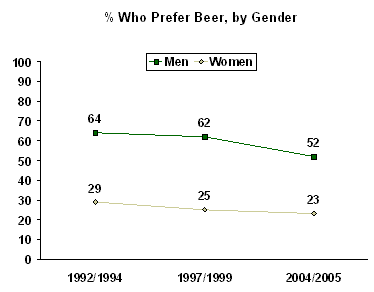
This advance for wine has come at the expense of beer. There has been virtually no change in preference for liquor among men and women, but the percentage naming beer has declined since 1992/1994 by 12 points among men, and by 6 points among women.
Minorities Switching to Wine
The national shift from beer to wine is especially pronounced among the nonwhite population. The long-term increase in preference for wine (since 1992/1994) has been +7 percentage points among white Americans, but +17 points among nonwhites. Similarly, the percentage of those preferring beer has fallen by 10 points among whites, but by 15 points among nonwhites.
|
Whites |
Nonwhites |
|
|
Wine |
|
|
|
1992/1994 |
29 |
22 |
|
1997/1999 |
34 |
28 |
|
2004/2005 |
36 |
39 |
|
|
|
|
|
Beer |
|
|
|
1992/1994 |
47 |
53 |
|
1997/1999 |
44 |
45 |
|
2004/2005 |
37 |
38 |
|
|
|
|
|
Liquor |
|
|
|
1992/1994 |
20 |
19 |
|
1997/1999 |
19 |
23 |
|
2004/2005 |
23 |
21 |
Future Gallup releases will review the extent of problem drinking in America, focusing on the relationship between age, type of alcohol preferred, and the self-reported tendency to sometimes drink too much.
* NOTE: Demographic trends are reported on the basis of two-year averages in order to increase sample size, and therefore, statistical reliability.
Survey Methods
These results are based on telephone interviews with a randomly selected national sample of 1,006 adults, aged 18 and older, conducted July 7-10, 2005. For results based on this sample, one can say with 95% confidence that the maximum error attributable to sampling and other random effects is ±3 percentage points.
For results based on the sample of 658 adults who drink alcoholic beverages, the maximum margin of sampling error is ±4 percentage points.
In addition to sampling error, question wording and practical difficulties in conducting surveys can introduce error or bias into the findings of public opinion polls.
30. Do you have occasion to use alcoholic beverages such as liquor, wine or beer, or are you a total abstainer?
|
Yes, drink |
No, total |
|
|
% |
% |
|
|
2005 Jul 7-10 |
63 |
37 |
|
|
|
|
|
2004 Jul 8-11 |
62 |
38 |
|
2003 Jul 7-9 |
62 |
38 |
|
2002 Jul 9-11 |
66 |
34 |
|
2001 Jul 19-22 |
62 |
38 |
|
2000 Nov 13-15 |
64 |
36 |
|
1999 Sep 23-26 |
64 |
36 |
|
1997 Jun 26-29 |
61 |
39 |
|
1996 Jun 27-30 |
58 |
42 |
|
1994 Jun 3-6 |
65 |
35 |
|
1992 Jan 16-19 |
64 |
35 |
|
1990 Dec 6-9 |
57 |
43 |
|
1989 Sep 12-15 |
56 |
44 |
|
1989 Apr 4-9 |
62 |
38 |
|
1988 Jul 1-7 |
63 |
37 |
|
1988 Mar 8-12 |
62 |
38 |
|
1987 Jul 10-13 |
65 |
35 |
|
1987 Apr 10-13 |
63 |
37 |
|
1987 Mar 14-18 |
65 |
35 |
|
1985 Feb 15-18 |
67 |
33 |
|
1984 Sep 6-9 |
64 |
36 |
|
1984 Jul 6-9 |
64 |
36 |
|
1983 Mar 11-14 |
65 |
35 |
|
1982 Aug 13-16 |
65 |
35 |
|
1981 Jan 9-12 |
70 |
30 |
|
1979 May 4-7 |
69 |
31 |
|
1978 Nov 10-13 |
66 |
34 |
|
1978 Apr 21-24 |
71 |
29 |
|
1977 Jan 14-17 |
71 |
29 |
|
1976 |
71 |
29 |
|
1974 May 10-13 |
68 |
32 |
|
1969 Jan 1-6 |
64 |
36 |
|
1969 Feb 22-27 |
63 |
37 |
|
1966 Jan 21-26 |
65 |
35 |
|
1964 |
63 |
37 |
|
1960 Mar 30-Apr 4 |
62 |
38 |
|
1959 Dec 10-15 |
61 |
39 |
|
1958 Jan 24-29 |
55 |
45 |
|
1957 Mar 15-20 |
58 |
42 |
|
1956 Jan 6-11 |
60 |
40 |
|
1952 Dec 11-16 |
60 |
40 |
|
1951 Aug 26-31 |
59 |
41 |
|
1950 Jun 4-9 |
60 |
40 |
|
1949 Dec 1-6 |
58 |
42 |
|
1947 Oct 3-8 |
63 |
37 |
|
1946 Jul 26-31 |
67 |
33 |
|
1945 Nov 23-28 |
67 |
33 |
|
1939 |
58 |
42 |
33. Do you most often drink liquor, wine, or beer?
BASED ON 658 WHO DRINK ALCOHOLIC BEVERAGES
|
|
|
|
|
ALL/ |
OTHER |
No |
|
% |
% |
% |
% |
% |
% |
|
|
2005 Jul 7-10 |
21 |
39 |
36 |
3 |
* |
1 |
|
|
|
|
|
|
|
|
|
2004 Jul 8-11 |
24 |
33 |
39 |
4 |
* |
* |
|
2003 Jul 7-9 |
22 |
33 |
42 |
3 |
* |
* |
|
2002 Jul 9-11 |
22 |
30 |
44 |
3 |
1 |
* |
|
2001 Jul 19-22 |
18 |
31 |
46 |
4 |
* |
1 |
|
2000 Nov 13-15 |
22 |
31 |
43 |
3 |
0 |
1 |
|
1999 Sep 23-26 |
19 |
34 |
42 |
4 |
* |
1 |
|
1997 Jun 26-29 |
18 |
32 |
45 |
4 |
* |
1 |
|
1996 Jul 25-28 |
20 |
27 |
46 |
6 |
0 |
1 |
|
1994 Jun 3-6 |
18 |
29 |
47 |
3 |
1 |
2 |
|
1992 Jan 16-19 |
21 |
27 |
47 |
3 |
1 |
1 |
|
* Less than 0.5% |
||||||
|
(vol.) = Volunteered response |
||||||
