Story Highlights
- About half of Americans are Protestant; a quarter are Catholic
- 19% of Americans do not have a formal religious identity
- Mormons attend religious services most frequently
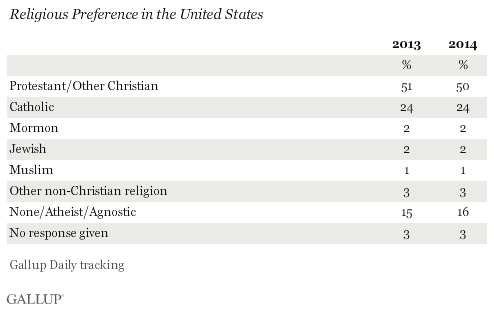
PRINCETON, N.J. -- About three in four Americans interviewed in 2014 name a Christian faith when asked for their religious preference, including 50% who are Protestants or another non-Catholic Christian religion, 24% who are Catholic and 2% who are Mormon.

These data are based on 173,490 interviews conducted from Jan. 2 through Dec. 21 as part of Gallup Daily tracking.
The proportion of Americans identifying as Protestant dropped by one percentage point from 2013 to 2014, while the Catholic and Mormon percentages stayed essentially the same.
About 6% of Americans identify with a non-Christian religion, including 2% who are Jewish, less than 1% who are Muslim and 3% who identify with other non-Christian religions. This leaves 16% who say they don't have a religious preference, along with another 3% who don't answer the question. This combined 19% without a formal religious identity is up one point from 2013.
The slight erosion of Americans' identification as Protestant and concomitantly slight increase in the percentage with no religious preference exemplifies general trends in religious identity over the past decades. In the 1950s, Gallup surveys showed that up to 71% of Americans identified as Protestant, and small percentages had no religious identity. Then, as now, however, well more than 90% of Americans who express a religious preference identify themselves as Christians.
Majority Attend Religious Services Monthly or More Frequently
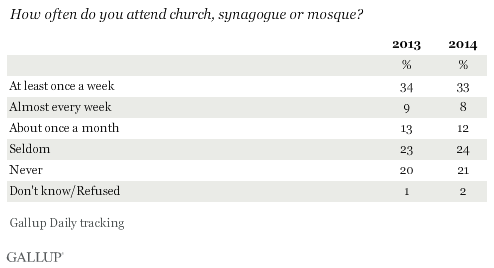
More than half (53%) of Americans in 2014 report attending religious services at least monthly, including 41% who attend weekly or almost every week. Only one in five say they never attend religious services. These numbers reflect a slight shift to less frequent attendance compared with 2013.

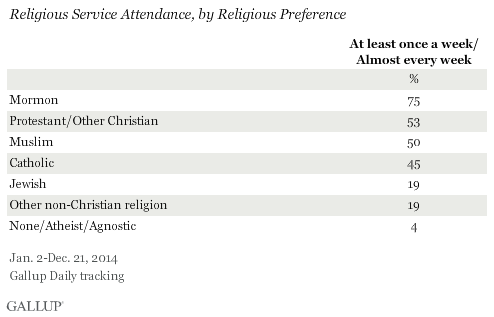
Religious service attendance varies widely across segments of the U.S. population, including significant differences among specific religious groups. Mormons report the highest attendance of any of the major religious groups, with 75% attending weekly or almost every week. Protestants are next on the attendance list, followed by Muslims and Catholics. Attendance among Jews and those who identify with other non-Christian religions is significantly lower than that for Christians and Muslims. As would be expected, few of those who have no religious preference report attending services frequently.

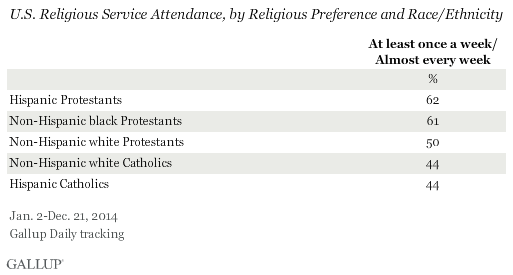
Protestants make up the largest single segment of the religious landscape in the U.S., and church attendance varies among segments of this large group. The split in attendance among Protestants by race and ethnicity is particularly interesting. U.S. Hispanics are predominantly Catholic, but a substantial 27% in 2014 identified themselves as Protestants. More than seven in 10 blacks are Protestants. Both black and Hispanic Protestants report much higher attendance than do white Protestants.
There is little difference in attendance between Hispanic and non-Hispanic white Catholics. About a third of all Catholics in the U.S. are Hispanic.

Implications
The U.S. remains a largely Christian nation, with over three-quarters of Americans identifying as Protestant, Catholic or Mormon. The U.S. also remains a generally observant nation as measured by Americans' self-reported attendance at religious services. Eight in 10 Americans attend religious services at least occasionally, while more than half attend monthly or more frequently. Mormons attend religious services most frequently, while those who identify as Jewish or with some other non-Christian religions attend the least.
Survey Methods
Results for this Gallup poll are based on telephone interviews conducted Jan. 2-Dec. 21, 2014, on the Gallup U.S. Daily survey, with a random sample of 173,490 adults, aged 18 and older, living in all 50 U.S. states and the District of Columbia. For results based on the total sample of national adults, the margin of sampling error is ±1 percentage point at the 95% confidence level. Results based on smaller subgroups of the population defined by religious preference and race and ethnicity will have larger margins of sampling error, depending on sample size. All reported margins of sampling error include computed design effects for weighting.
Each sample of national adults includes a minimum quota of 50% cellphone respondents and 50% landline respondents, with additional minimum quotas by time zone within region. Landline and cellular telephone numbers are selected using random-digit-dial methods.
Learn more about how Gallup Daily tracking works.

