Story Highlights
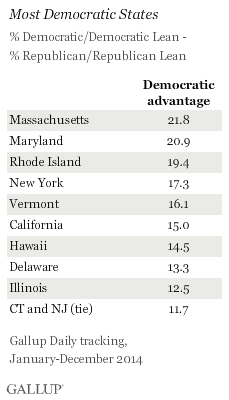
- Massachusetts and Maryland are most Democratic states
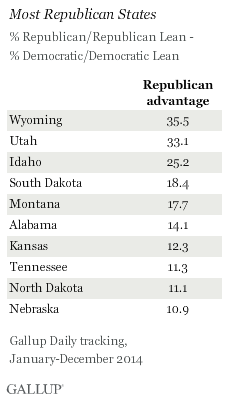
- Wyoming and Utah are most Republican states
- Similar numbers of Republican, Democratic, competitive states
This story is part of Gallup's annual "State of the States" series, which reveals state-by-state differences on political, economic, religion and well-being measures.
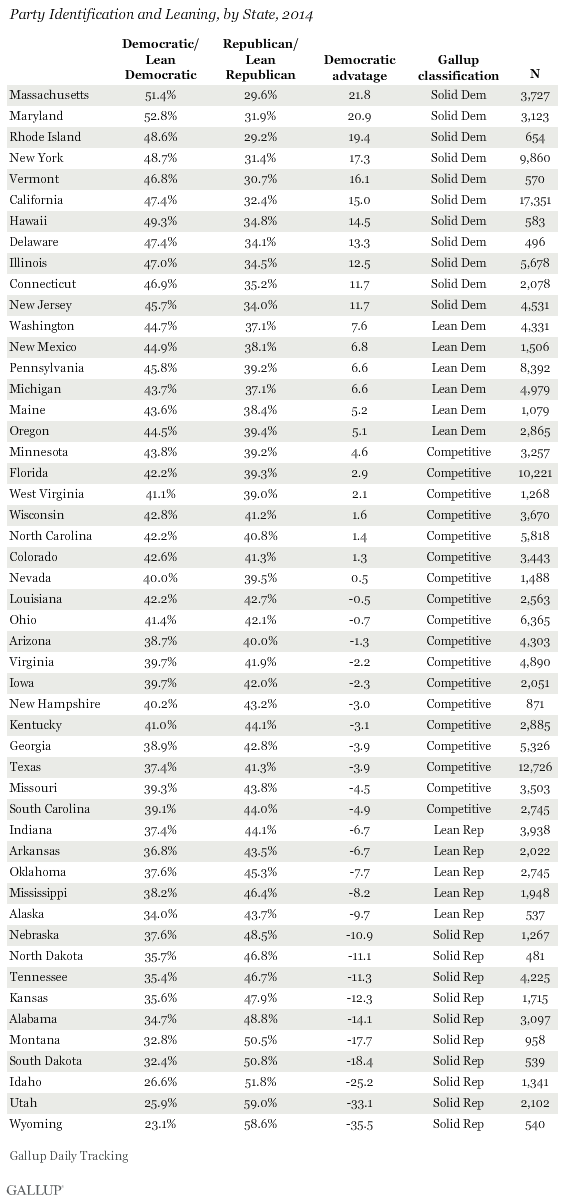
PRINCETON, N.J. -- Massachusetts and Maryland rank as the most Democratic states, and Wyoming and Utah are the most Republican, based on the political party identification and leanings of their state residents in 2014. The Democratic advantage in Massachusetts and Maryland exceeds 20 percentage points, while Utah and Wyoming show Republican advantages of more than 30 points.
The results are based on Gallup Daily tracking interviews throughout 2014 with more than 177,000 U.S. adults. Gallup asks Americans whether they identify with the Democratic or Republican Party. Independents and those who express no party preference are subsequently asked whether they lean more toward the Democratic Party or the Republican Party.
The combined percentage of residents who identify with the Democratic Party or lean toward it, versus the percentage of Republican identifiers and leaners, gives an indication of the relative strength of each party within a state. The full 2014 results for each state are shown in a table at the end of the article. Nationally, Democrats had a slim three-percentage-point advantage in 2014.
The rank order of the states based on their partisanship has been fairly consistent over time. Since Gallup began reporting on state party identification seven years ago, nine states have ranked in the top 10 most Democratic every year, including Massachusetts, Maryland, Rhode Island, New York, Vermont, California, Hawaii, Delaware and Illinois. New Jersey and Connecticut tied for 10th this year, and one or the other has been in the top 10 every year since 2008. Maine is the only other state to rank among the 10 most Democratic since 2008, tying for 10th in 2008.
There has been more variation in the Republican top 10 over time, with 17 different states appearing at least once since 2008. Wyoming and Utah have been the two most Republican states each year, with Idaho placing third in all but two years. In addition to those states, Kansas and Nebraska have ranked in the top 10 every year. Montana, Alabama, North Dakota and Alaska have been in the top 10 all but one year.
Solid, Leaning and Competitive States
The 10 most Democratic and 10 most Republican states all have party gaps greater than 10 percentage points. Gallup classifies these states as solid Democratic or solid Republican. A smaller set of states show a party advantage of greater than five points but less than 10 points. On this basis, Gallup classifies six states as leaning Democratic (Washington state, New Mexico, Pennsylvania, Michigan, Maine and Oregon) and five states as leaning Republican (Alaska, Mississippi, Oklahoma, Arkansas and Indiana).
The remaining 18 "competitive" states have a party advantage for either party of no greater than five percentage points. Within this group, Louisiana, Nevada and Ohio are the most competitive states, with less than one percentage point difference between the two parties.
The solidly Republican states are mainly clustered in the northern part of the Mountain West region and in the western Plains states. The solidly Democratic states are largely in New England and the Middle Atlantic region, but also include two of the more populous states in California and Illinois. Many of the Midwestern states are competitive, along with the southern states bordering the Atlantic Ocean.
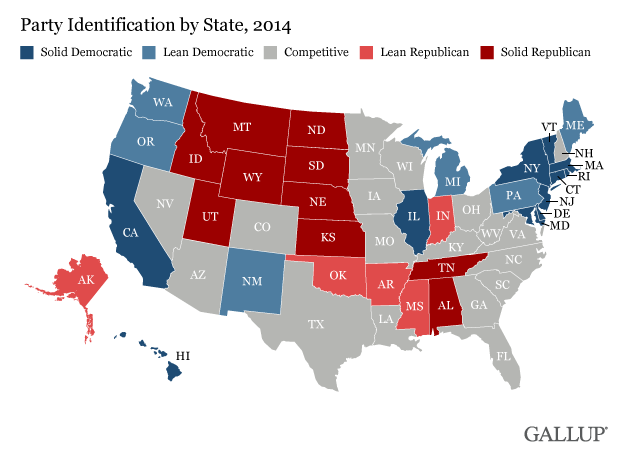
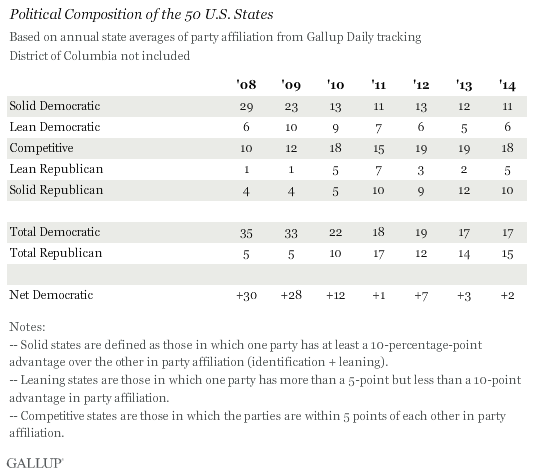
There are similar numbers of states in each of the major categories, including 17 solid or leaning Democratic states, 15 that are solid or leaning Republican and 18 that are competitive. Those totals have been fairly consistent since 2011 -- but continue to mark a major shift away from the Democratic Party since 2008, the apex for Democratic strength nationally in the last 25 years. That year, Gallup classified 29 states as solidly Democratic and an additional six as leaning Democratic, to only five solid or leaning Republican.
Nine states saw their classification change between 2013 and 2014. Three states that were competitive in 2013 are now considered leaning, including Pennsylvania (now leaning Democratic), Indiana (now leaning Republican) and Arkansas (also leaning Republican). Minnesota and South Carolina moved to competitive status, from lean Democratic and solid Republican, respectively. Meanwhile, Oklahoma and Alaska shifted from solid Republican to lean Republican, Tennessee from lean Republican to solid Republican and New Mexico from solid Democratic to lean Democratic.
Implications
A state's partisanship is an indicator of how the state will vote in federal and state elections, as well as the types of policies that will become law in those states. Of course, the figures presented here are based on all state residents, and differences in turnout, which usually favor Republicans, can alter the political balance of the state electorate in a given election.
Since 2008, there has been a significant movement away from the Democratic Party both at the national level and in many states. Democrats still maintain a modest advantage in national partisanship, partly because they have an advantage in some of the most highly populated states such as California, New York and Illinois. At the same time, other large states like Florida and Texas are competitive, with Florida showing a slight Democratic edge and Texas a slight Republican one.
In fact, Tennessee and Indiana, which rank 16th and 17th in terms of population, are the most populous states that are either solidly Republican or leaning Republican. The GOP's inability to dominate in many high population, electoral vote-rich states underscores the challenges it faces in presidential elections based on the winner-take-all electoral vote system. The GOP can overcome that deficit with better turnout to some degree, but also must carry the vast majority of competitive states in order to win the election.
Survey Methods
Results for this Gallup poll are based on telephone interviews conducted Jan. 2-Dec. 30, 2014, on the Gallup Daily tracking survey, with a random sample of 177,034 adults, aged 18 and older, living in all 50 U.S. states and the District of Columbia.
For results based on the total sample of national adults, the margin of sampling error is ±1 percentage point at the 95% confidence level.
Margins of error for individual states are no greater than ±6 percentage points, and are ±3 percentage points in most states. All reported margins of sampling error include the computed design effects for weighting.
Interviews are conducted with respondents on landline telephones and cellular phones, with interviews conducted in Spanish for respondents who are primarily Spanish-speaking. Each sample of national adults includes a minimum quota of 50% cellphone respondents and 50% landline respondents, with additional minimum quotas by time zone within region. Landline and cellular telephone numbers are selected using random-digit-dial methods. Landline respondents are chosen at random within each household on the basis of which member had the most recent birthday.
Samples are weighted to correct for unequal selection probability, nonresponse and double coverage of landline and cell users in the two sampling frames. National samples are weighted to match the national demographics of gender, age, race, Hispanic ethnicity, education, region, population density and phone status (cellphone only/landline only/both, cellphone mostly and having an unlisted landline number). Demographic weighting targets are based on the most recent Current Population Survey figures for the aged 18 and older U.S. population. Phone status targets are based on the most recent National Health Interview Survey. Population density targets are based on the most recent U.S. census. State samples are weighted to match state demographics of gender, age, race, Hispanic ethnicity and region. State demographic weighting targets are based on the most recent Nielsen Claritas dataset.
Learn more about how the Gallup U.S. Daily works.