Story Highlights
- North Port-Sarasota-Bradenton, Florida, tops list
- California, North Carolina, Texas all have two communities in highest 10
- Ohio has five communities in lowest 10
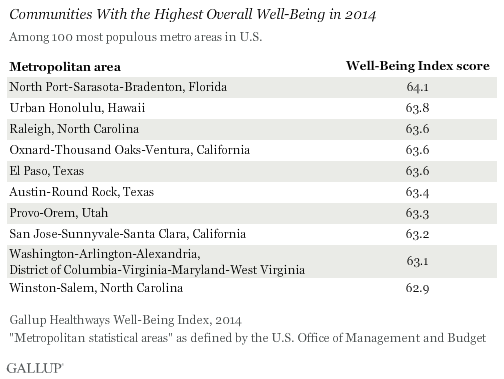
WASHINGTON, D.C. -- North Port-Sarasota-Bradenton, Florida, has the highest Well-Being Index score (64.1) across the 100 most populous communities in the U.S., according to the Gallup-Healthways Well-Being Index. Rounding out the top five are Urban Honolulu, Hawaii; Raleigh, North Carolina; Oxnard-Thousand Oaks-Ventura, California; and El Paso, Texas.

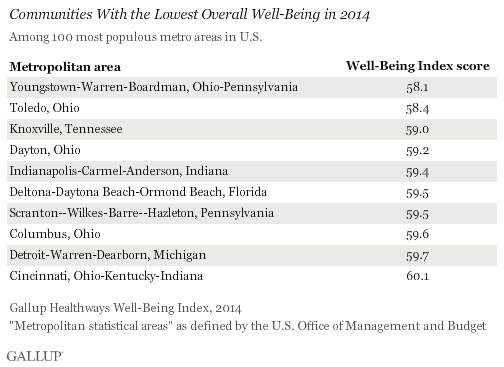
The three communities with a Well-Being Index score of 59.0 or lower are Youngstown-Warren-Boardman, Ohio-Pennsylvania; Toledo, Ohio; and Knoxville, Tennessee. In addition to Youngstown and Toledo, the state of Ohio has three other communities among the 10 ranked lowest for well-being: Dayton, Columbus and Cincinnati. Ohio ranked 46th among the 50 states in well-being in 2014, and is one of five states to have finished among the lowest 10 every year since Gallup and Healthways began measuring well-being in 2008.

As a group, many substantial differences distinguish the lowest well-being communities from the highest. For example, compared with residents of the highest well-being communities, residents of the lowest are 32% less likely to have someone in their lives encouraging them to make healthy choices. They are also 35% more likely to have experienced food insecurity in the last 12 months, 68% more likely to smoke, 26% more likely to be obese, 55% less likely to like what they do each day and 58% more likely to not feel pride in their community.
Some communities that have appeared on these highest and lowest community well-being lists in prior years, such as Boulder, Colorado, and Huntington-Ashland-Ironton, West Virginia-Ohio-Kentucky, are not among the 100 most populous metro areas and therefore are not part of the 2014 reporting.
These community-level data are based on more than 176,000 interviews with U.S. adults across all 50 states and the District of Columbia, conducted from January through December 2014. All reported communities are metropolitan statistical areas as defined by the U.S. Office of Management and Budget. The Well-Being Index is calculated on a scale of 0 to 100, where 0 represents the lowest possible well-being and 100 represents the highest possible well-being. The Gallup-Healthways Well-Being Index score for the nation and for each community comprises metrics affecting overall well-being and each of the five essential elements of well-being:
- Purpose: liking what you do each day and being motivated to achieve your goals
- Social: having supportive relationships and love in your life
- Financial: managing your economic life to reduce stress and increase security
- Community: liking where you live, feeling safe and having pride in your community
- Physical: having good health and enough energy to get things done daily
Gallup and Healthways have tracked well-being since 2008 and updated the Well-Being Index in 2014 to provide a more comprehensive measure of well-being. The Well-Being Index scores for 2014 are not directly comparable to the scores from prior years because they are calculated using a revised instrument and scoring methodology.
The regional breakdown in well-being scores for communities is largely consistent with Gallup and Healthways state-level results, which show well-being is generally higher in the Northern Plains, Mountain West and West, and lower in the South and Industrial Midwest.
El Paso Leads Large U.S. Communities in Purpose, Physical Well-Being
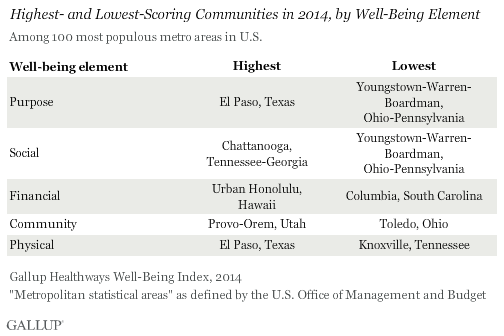
El Paso is the only community with the highest well-being in more than one element, leading in purpose and physical well-being. Provo-Orem, Utah, leads in community well-being, while Urban Honolulu is No. 1 in financial well-being. Residents of Chattanooga, Tennessee-Georgia, have the highest social well-being.
Youngstown, in turn, is the only community with the lowest well-being in more than one element, trailing in both purpose and social well-being. Toledo has the lowest community well-being, giving Ohio metro areas the lowest spot on three out of five elements. Residents of Columbia, South Carolina, have the lowest financial well-being for large communities, and those of Knoxville have the lowest physical well-being.

North Port-Sarasota-Bradenton, the community with the highest overall Well-Being Index score, does not lead in any element, but is in the top 12 in all five elements. This community is characterized by particularly strong physical, financial and social well-being, ranked second, second and fourth in the nation, respectively, in those elements. Raleigh, Oxnard-Thousand Oaks-Ventura and Chattanooga each have three well-being elements in the top 10.
Implications
The communities with the highest well-being often have many shared characteristics that are much less common among their lower well-being counterparts. The characteristics distinguishing high well-being communities are multifaceted, often spanning multiple well-being elements.
For example, residents of high well-being communities exercise more frequently -- an important aspect of physical well-being -- but they are also more likely to report that someone close to them encourages them to be healthy, a critical component of social well-being. They are much less likely to be obese, they have fewer significant chronic health conditions, and they feel safe where they live. Those who feel safe where they live are, in turn, more likely to have access to a safe place to exercise and access to fresh produce, which are important community characteristics that are linked to lower levels of obesity.
While those living in high well-being communities are more likely to have basic access to food and healthcare, they are also more likely to manage their money effectively and to live within their means, which are crucial components of financial well-being. People in high well-being communities also report being able to use their strengths on any given day and are more likely to learn new and interesting things, two key aspects of purpose well-being.
Ultimately, residents of the top well-being places in the U.S. are more likely to be thriving across each of the five critical elements of well-being, thus capitalizing on the synergistic benefits of each element acting in concert with one another. This may reflect what is perhaps the most important factor separating the nation's high well-being communities from those with lower well-being: a holistic view of well-being. Leaders in lower well-being communities can study and adapt the distinguishing features of high well-being communities to enhance the overall health of their residents.
"Improving and sustaining high well-being is vital to any population's overall health and economy," says Janet Calhoun, senior vice president at Healthways. "State, local and business leaders should consider specific well-being interventions that make the healthy choice the easy choice for their population. A comprehensive long-term environmental strategy creates not only a healthier population, but also a more productive workforce and a more robust economy."
Survey Methods
Results are based on telephone interviews conducted as part of the Gallup-Healthways Well-Being Index survey Jan. 2-Dec. 29, 2014, with a random sample of 176,702 adults, aged 18 and older, living in metropolitan areas in the 50 U.S. states and the District of Columbia, selected using random-digit-dial sampling. Unlike previous years, only the 100 most populous metros -- as determined by the U.S. Census Bureau -- were reported in 2014. A second requirement is that at least 300 cases are required per metro area for reporting. As such, McAllen-Edinburg-Mission, Texas, and Durham-Chapel Hill, North Carolina, were both excluded from reporting due to an insufficient sample size. These were replaced by the 102nd-largest metropolitan statistical area (MSA) in the U.S.: Lancaster, Pennsylvania.
The "communities" referenced in this article are based on MSAs as defined by the U.S. Office of Management and Budget. In many cases, more than one city is included in the same MSA. The San Jose, California, MSA, for example, also includes the smaller nearby cities of Sunnyvale and Santa Clara in addition to San Jose. Each respondent is attributed to his or her MSA based on self-reports of his or her ZIP code.
Maximum margins of error for the Well-Being Index and the element scores vary according to MSA size, ranging from less than 1 point for the largest cities represented to around ±1.5 points for many of the smallest cities.
All reported margins of sampling error include computed design effects for weighting.
Each sample of national adults includes a minimum quota of 50% cellphone respondents and 50% landline respondents, with additional minimum quotas by time zone within region. Landline and cellular telephone numbers are selected using random-digit-dial methods.

