Story Highlights
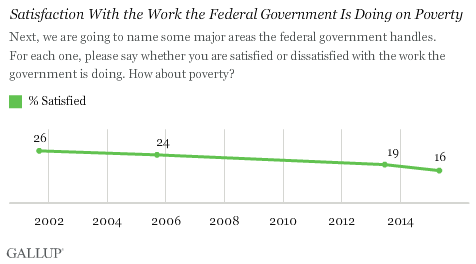
- 16% satisfied with federal government efforts on poverty
- Satisfaction with poverty usually among lowest for issues
- Republican satisfaction has declined since Bush years
PRINCETON, N.J. -- Sixteen percent of Americans are satisfied with the work the federal government is doing to address poverty, a new low in Gallup's 15-year trend. During this time, Americans have never been too satisfied with the government's efforts on poverty; the high point of 26% satisfaction came the first time it was measured in a Sept. 7-10, 2001, poll.
The current results are based on an April 29-May 2 Gallup survey that asked respondents to rate their satisfaction with the federal government's work in 20 different areas. The government's handling of poverty ranks last this year, just below its handling of the nation's finances (23%) and immigration policy (24%). Americans are most satisfied with mail delivery, at 90%.
Poverty has also ranked at or near the bottom of this list in prior surveys:
- In 2001, satisfaction with poverty was the lowest ranked issue, one percentage point behind healthcare at 27%.
- In 2005, satisfaction with the nation's finances, at 23%, edged out poverty and healthcare, both at 24%, for the bottom spot.
- In 2013, Americans were least satisfied with the federal government's handling of the nation's finances at 14%, with poverty next lowest at 19%.
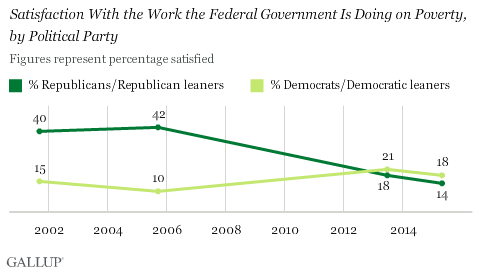
Political Right Leads Drop in Satisfaction With Poverty Efforts
Declining satisfaction among self-identified Republicans and Republican-leaning independents is the primary driver of the decline in satisfaction with federal poverty efforts overall. In 2001 and 2005, when Republican George W. Bush was president, roughly four in 10 Republicans and Republican-leaners were satisfied with government actions to address poverty. Since then, with Democratic President Barack Obama in office, Republican satisfaction has shrunk to 14%. Over this same time, there has been a slight increase in Democratic satisfaction, but nowhere near large enough to offset the decline in Republican satisfaction.
The same general patterns are seen by ideology, with self-described conservatives' satisfaction with poverty efforts down sharply from 36% in 2001 to 16% today, while liberals' satisfaction is up only slightly, from 10% to 17%.
The net result of these changes is that Republicans, Democrats, conservatives and liberals now show roughly equal levels of satisfaction with U.S. government poverty efforts. There is also little difference in satisfaction among race, education, gender and age subgroups.
Implications
Poverty has been an ever-present problem in the U.S. Although it does not typically rank among the top issues, it consistently registers a modest number of mentions each month when Gallup asks Americans to name the most important problem facing the country.
Over the past 15 years, Americans have never been highly satisfied with government efforts to address poverty, and never has their satisfaction been lower than it is now. The lower level of satisfaction is partly a function of political dynamics whereby Republicans are more likely to be satisfied with government activities when a Republican is president. Republicans typically are also less likely than Democrats to see poverty as an important problem. Because of Democrats' greater concern about the issue and the difficulty the nation has had in greatly reducing poverty, Democrats may still have reason to be dissatisfied with government activity on the issue even when a Democratic president is in office.
Survey Methods
Results for this Gallup poll are based on telephone interviews conducted April 29-May 2, 2015, on the Gallup U.S. Daily survey, with a random sample of 1,011 adults, aged 18 and older, living in all 50 U.S. states and the District of Columbia. For results based on the total sample of national adults, the margin of sampling error is ±4 percentage points at the 95% confidence level. All reported margins of sampling error include computed design effects for weighting.
Each sample of national adults includes a minimum quota of 50% cellphone respondents and 50% landline respondents, with additional minimum quotas by time zone within region. Landline and cellular telephone numbers are selected using random-digit-dial methods.
Learn more about how the Gallup U.S. Daily works.