Story Highlights
- Older adults in DE have largest well-being edge relative to state overall
- Those aged 55+ also faring well in Oregon, Iowa and New Hampshire
- Older residents of Wyoming have smallest well-being edge
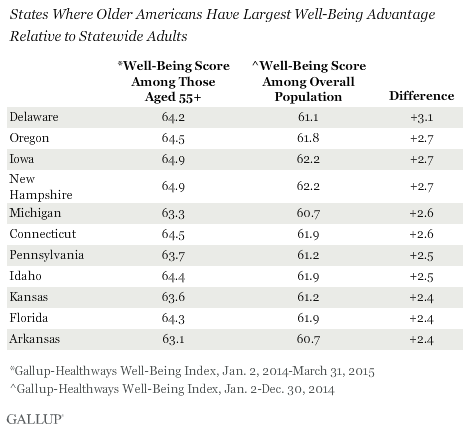
WASHINGTON, D.C. -- In all 50 states, residents aged 55 and older have higher well-being than the state's population as a whole. Older Delaware residents have the largest well-being advantage relative to the overall state population, followed closely by Oregon, Iowa and New Hampshire.

Other states where older adults have a statistically significant well-being edge relative to the overall state population include Michigan, Connecticut, Pennsylvania, Idaho, Kansas, Florida and Arkansas.
Well-being is measured using the Gallup-Healthways Well-Being Index. The Well-Being Index is calculated on a scale of zero to 100, where zero represents the lowest possible well-being and 100 represents the highest possible well-being. The Well-Being Index for each state includes five essential elements of well-being -- purpose, social, financial, community and physical.
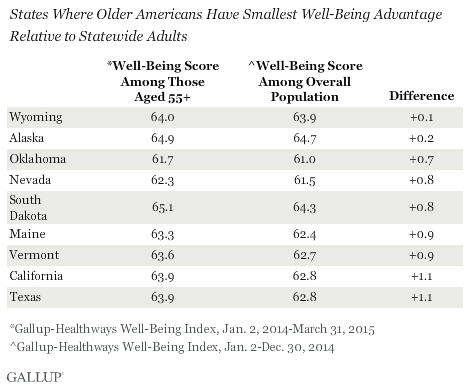
The state where older Americans' well-being advantage is smallest is Wyoming, followed by Alaska, Oklahoma, Nevada, South Dakota, Maine and Vermont. Older adults in California and Texas also have smaller advantages than older residents in other states.

In an absolute sense, Hawaii, Montana, South Dakota, Alaska and Iowa are the top five states for well-being for older Americans -- states that also have high well-being rankings for the overall population. States with the lowest well-being for older Americans are also those where well-being as a whole tends to lag behind the rest of the country: West Virginia, Kentucky and Oklahoma. To read more about the well-being of older Americans nationally and by state, read the new Gallup-Healthways report, State Well-Being Rankings for Older Americans.
Implications
Previous Gallup and Healthways research shows that older Americans tend to have higher overall well-being than younger Americans do. This analysis reveals that this pattern also holds true in all 50 states. Compared with younger adults, Americans aged 55 and older express more satisfaction with their standard of living, worry less about money, have better access to healthcare, are more likely to have health insurance, eat more fresh produce and are less likely to smoke.
The well-being of older Americans is a critical measure for national, state and local leaders to measure and improve upon. Well-Being Index scores predict important outcomes such as life expectancy, healthcare utilization, new onset disease burden, employment, absenteeism and change in obesity status.
"There are proven and effective interventions that combine social and physical activities to keep people healthy, active and productive as they age," says Joy Powell, Market President at Healthways. "Our research shows that older Americans who are thriving in well-being exercise far more, have less depression and have lower rates of obesity and chronic illness."
As the baby boomer population ages, state leaders should actively monitor and address their older population's well-being deficits. Taking steps to improve on this important metric could significantly benefit older individuals' quality of life and reduce healthcare costs.
Survey Methods
Results are based on telephone interviews conducted Jan. 2-Dec. 30, 2014, as part of the Gallup-Healthways Well-Being Index survey, with a random sample of 173,656 adults, aged 18 and older, living in all 50 U.S. states and the District of Columbia. For results based on the total sample of national adults, the margin of sampling error for the Well-Being Index score is ±0.1 percentage points at the 95% confidence level. The margin of sampling error for most states is about ±0.6 points, although this increases to about ±1.6 points for the smallest-population states such as North Dakota, Wyoming, Hawaii and Delaware.
For the sample of adults aged 55 and older, interviews were conducted Jan. 2, 2014-March 31, 2015. For results based on the total sample of Americans aged 55 and older (114,388), the margin of sampling error is ±0.1 percentage points at the 95% confidence level. The margin of sampling error for most states is about ±1.5 points, although this increases to about ±2.1 points for the smallest-population states such as North Dakota, Wyoming, Hawaii and Delaware.
All reported margins of sampling error include computed design effects for weighting.
Each sample of national adults includes a minimum quota of 50% cellphone respondents and 50% landline respondents, with additional minimum quotas by time zone within region. Landline and cellular telephone numbers are selected using random-digit-dial methods.
Learn more about how the Gallup-Healthways Well-Being Index works.

