GALLUP NEWS SERVICE
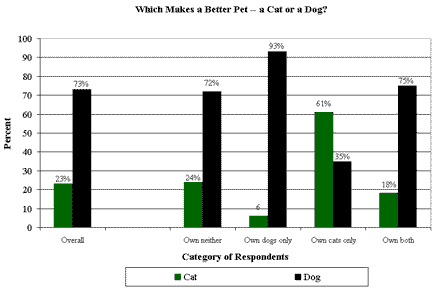
PRINCETON, NJ -- In the perennial argument over which species of animal -- canines or felines -- are "man's best friend," a new Gallup poll suggests that Americans overall have given their heartfelt endorsement to the traditional favorite. By a margin of 73% to 23%, Americans say that dogs, rather than cats, are the "better pet." These results are similar to those found five and a half years ago, when a Gallup poll also found dogs the winner by more than a three-to-one margin, 65% to 20%.
The public's widespread pro-canine sentiments are not simply a reflection of greater dog ownership, as the poll shows only a relatively slight advantage in the number of dog owners over cat owners. Overall, 45% of Americans own one or more dogs, while 34% own one or more cats. The perceptual advantage dogs have over cats comes not just from dog owners, but from the 41% of Americans who currently own neither a cat nor a dog, as well as the 20% of Americans who own both. Those who own only dogs, of course, express the most lopsided sentiment in favor of that pet, with 93% saying dogs are better and just 6% choosing cats. But people who own both cats and dogs -- and, presumably, ought to have the best insight into such delicate matters -- also opt for dogs, by 75% to 18%. People who don't even own a pet, who perhaps are just reacting to the different reputations of the two animals, favor dogs by a similar margin of 72% to 24%. Only people who own cats -- and cats alone -- constitute a pro-cat majority, as 61% of this group choose their furry felines as the better pet. Still, more than a third of these exclusive cat owners -- 35% -- rate dogs as better.

Cat Owners Have More Cats Than Dog Owners Have Dogs, But
Still There Are More Dogs Than Cats Nationwide
The poll shows that 25% of all Americans own only a dog, 14% own
only a cat, and 20% own both. Cat owners tend to have more cats per
household than dog owners have dogs, but the number is not so great
as to suggest there are actually more pet cats in this country than
pet dogs. Among cat owners, the average number of cats in the
household is 2.1, compared with 1.8 dogs among dog owners. However,
when the total number of cats and dogs is compared across all
households, Gallup results suggest that for every 100 households in
the country, there are about 79 dogs and 68 cats. (These results
say nothing about stray animals, since the question asked
respondents how many cats and dogs they "owned." There could be
more stray cats than dogs, or vice versa, which would affect how
many of each animal are actually in the country.)
In a 1996 Gallup poll, the average number of dogs among the 43% of people who owned dogs was 1.5, smaller than the current measure; and the average number of cats among the 31% who were cat owners was 2.11, higher than the current number. Those numbers translated into about 64.5 dogs and 65.4 cats per one hundred households, causing Gallup analysts to conclude that there were "marginally" more pet cats than pet dogs in the country at that time. In the two previous polls conducted by Gallup, in 1990 and 1956, not only did dog owners outnumber cat owners, but the number of dogs also outnumbered cats. These results are shown in the table below:
|
Year |
Dogs/ 100 Households |
Cats/ 100 Households |
|
2001 |
79 |
68 |
|
1996 |
64.5 |
65.4 |
|
1990 |
62 |
52 |
|
1956 |
51 |
42 |
Ownership of Cats and Dogs Widespread
The poll also shows that about half or more of Americans at all
income levels own either a cat or a dog, although wealthier
Americans are somewhat more likely than lower income Americans to
own at least one of these pets. Of those earning under $20,000 a
year, just over half -- 52% -- own either pet, compared with 65% of
Americans earning over $50,000 a year.
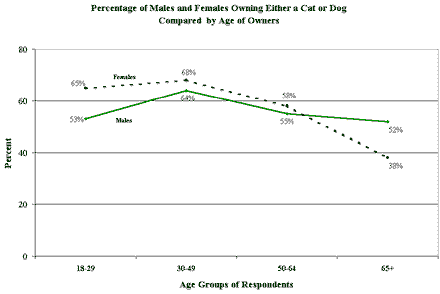
Overall, there is little difference between males and females in dog and cat ownership, although there are some gender differences by age groups. As shown in the accompanying graph, the youngest females are more likely to own a pet than are the youngest males, by 65% to 53%. The two middle age categories show about the same level of ownership among men and women, but the oldest age category shows males more likely than females to own a pet, by 52% to 38%.

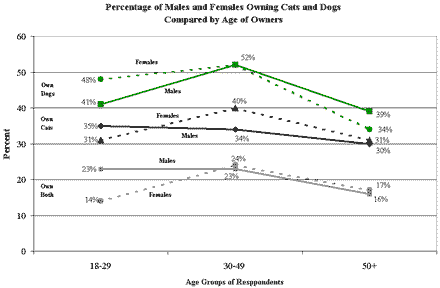
A more detailed analysis of ownership by gender and age shows that the stereotype of older women loving cats -- and lots of them -- is not supported by the Gallup results. As shown in the graph below, older men are just as likely to have cats as older women, and just as likely to have both dogs and cats. Older men are slightly more likely to have just dogs (39%) than are women (34%), but the difference is not very large.

Survey Methods
Results are based on telephone interviews with 1,016 national adults, aged 18+, conducted February 19-21, 2001. For results based on the total sample of national adults, one can say with 95% confidence that the margin of sampling error is +/- 3 percentage points. In addition to sampling error, question wording and practical difficulties in conducting surveys can introduce error or bias into the findings of public opinion polls.
Which animal do you think makes a better pet -- a cat or
dog?
|
|
|
NEITHER/EITHER |
No |
||
|
% |
% |
% |
% |
||
|
2001 Feb 19-21 |
23 |
73 |
-- |
4 |
|
|
1995 Aug 7-9 |
20 |
65 |
14 |
1 |
|
|
^ |
Gallup/US News and World Report/CNN Poll |
||||
Do you or does any other member of your household own a dog or dogs?
|
Yes |
No |
No opinion |
|
|
% |
% |
% |
|
|
2001 Feb 19-21 |
45 |
55 |
0 |
|
1996 Aug 23-25 |
43 |
57 |
* |
|
1990 |
40 |
60 |
* |
|
1956 |
35 |
65 |
0 |
How many dogs do you own?
BASED ON -- 443 -- DOG OWNERS.
|
|
|
|
|
2001 Feb 19-21 |
1.78 |
1 |
|
1996 Aug 23-25 |
1.50 |
1 |
|
1990 |
1.55 |
1 |
|
1956 |
1.46 |
1 |
Do you or does any other member of your household own a cat or cats?
|
Yes |
No |
No opinion |
|
|
% |
% |
% |
|
|
2001 Feb 19-21 |
34 |
66 |
0 |
|
1996 Aug 23-25 |
31 |
69 |
* |
|
1990 |
27 |
73 |
* |
|
1956 |
21 |
79 |
0 |
How many cats do you own?
BASED ON -- 341 -- CAT OWNERS.
|
|
|
|
|
2001 Feb 19-21 |
2.05 |
1 |
|
1996 Aug 23-25 |
2.11 |
1 |
|
1990 |
1.94 |
1 |
|
1956 |
2.0 |
1 |