GALLUP NEWS SERVICE
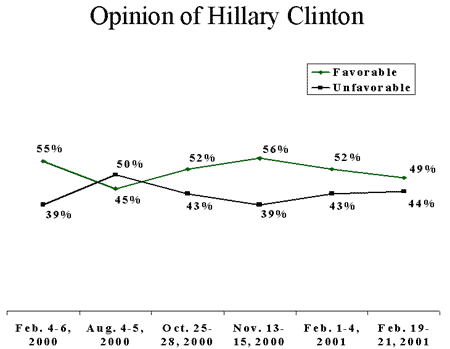
PRINCETON, NJ --As have her husband's, Hillary Clinton's favorable ratings have fallen in recent weeks, although her current favorable ratings do not match her all-time low, which occurred in 1996. The latest poll, conducted February 19-21, shows 49% of Americans with a favorable opinion of the New York senator, while 44% have an unfavorable opinion of her. In a February 1-4 poll, 52% of the public viewed her favorably and 43% unfavorably. Clinton had a higher rating following the 2000 election, when 56% of the public rated her favorably and 39% rated her unfavorably. The lowest favorable rating for Clinton came in January 1996, when only 43% of the public had a favorable opinion of her and 51% had an unfavorable opinion.

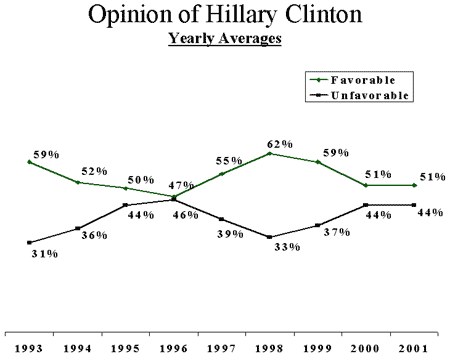
A yearly average of these ratings for Hillary Clinton over nine years reveals significant fluctuation. These rather large changes in the public's opinion of Clinton can be closely tied to certain events. During 1996, the Whitewater investigation into Clinton's past financial affairs drove her favorable rating to its lowest point. Her highest yearly average came in 1998, when her husband Bill Clinton was investigated and eventually impeached as a result of the Monica Lewinsky affair. Public sentiment toward Senator Clinton has cooled again in 2000 and 2001. The revelation that Clinton's brother, Hugh Rodham, received payments for helping two clients -- one receiving a pardon and the other receiving a commutation of his sentence from former President Clinton -- has the potential to damage her image further.

Survey Methods
The results below are based on telephone interviews with a randomly selected national sample of 1,016 adults, 18 years and older, conducted February 19-21, 2001. For results based on this sample, one can say with 95 percent confidence that the maximum error attributable to sampling and other random effects is plus or minus 3 percentage points. In addition to sampling error, question wording and practical difficulties in conducting surveys can introduce error or bias into the findings of public opinion polls.
Next, we'd like to get your overall opinion of some people in the news. As I read each name, please say if you have a favorable or unfavorable opinion of this person -- or if you have never heard of him or her. How about -- [RANDOM ORDER]?
Hillary Rodham Clinton
|
|
|
Unfavor-able |
No |
|
|
|
Unfavor-able |
No |
|
|
|
% |
% |
% |
|
|
% |
% |
% |
|
|
2001 |
|
|
|
|
1997 |
|
|
|
|
|
(NA) 2001 Feb 19-21 |
49 |
44 |
7 |
|
(NA) 1998 Jan 23-24 |
60 |
35 |
5 |
|
|
|
|
|
|
|
(NA) 1997 Dec 18-21 |
56 |
38 |
6 |
|
|
(NA) 2001 Feb 1-4 |
52 |
43 |
5 |
|
(NA) 1997 Oct 27-29 |
61 |
34 |
5 |
|
|
|
|
|
|
|
(NA) 1997 Jun 26-29 |
51 |
42 |
7 |
|
|
2000 |
|
|
|
|
(NA) 1997 Feb 24-26 |
51 |
42 |
6 |
|
|
(NA) 2000 Nov 13-15 |
56 |
39 |
5 |
|
(NA) 1997 Jan 31-Feb 2 |
55 |
39 |
6 |
|
|
(NA) 2000 Oct 25-28 |
52 |
43 |
5 |
|
(NA) 1997 Jan 10-13 |
56 |
37 |
7 |
|
|
(NA) 2000 Aug 4-5 |
45 |
50 |
5 |
|
1996 |
|
|
|
|
|
(NA) 2000 Feb 4-6 |
55 |
39 |
6 |
|
(LV) 1996 Oct 26-29 |
49 |
43 |
8 |
|
|
1999 |
|
|
|
|
(RV) 1996 Aug 28-29 |
51 |
41 |
8 |
|
|
(NA) 1999 Dec 9-12 |
48 |
48 |
4 |
|
(RV) 1996 Aug 16-18 |
47 |
48 |
5 |
|
|
(NA) 1999 Sep 23-26 |
56 |
40 |
4 |
|
(RV) 1996 Aug 5-7 |
48 |
45 |
7 |
|
|
(NA) 1999 Aug 3-4 |
56 |
41 |
3 |
|
(NA) 1996 Jun 18-19 |
46 |
47 |
6 |
|
|
(NA) 1999 Jul 22-25 |
62 |
35 |
3 |
|
(NA) 1996 Mar 15-17 |
47 |
48 |
5 |
|
|
(NA) 1999 Jun 25-27 |
56 |
42 |
2 |
|
(NA) 1996 Jan 12-15 |
43 |
51 |
6 |
|
|
(NA) 1999 Mar 5-7 |
65 |
31 |
4 |
|
1995 |
|
|
|
|
|
(NA) 1999 Feb 19-21 |
65 |
30 |
5 |
|
(NA) 1995 Jul 7-9 |
50 |
44 |
6 |
|
|
(NA) 1999 Feb 4-8 |
66 |
31 |
3 |
|
(NA) 1995 Mar 17-19 |
49 |
44 |
7 |
|
|
1998 |
|
|
|
|
(NA) 1995 Jan 16-18 |
50 |
44 |
6 |
|
|
(NA) 1998 Dec 28-29 |
67 |
29 |
4 |
|
1994 |
|
|
|
|
|
(NA) 1998 Oct 9-12(‡) |
63 |
33 |
4 |
|
(NA) 1994 Nov 28-29 |
50 |
44 |
6 |
|
|
(NA) 1998 Sep 14-15 |
61 |
33 |
6 |
|
(NA) 1994 Sep 6-7 |
48 |
47 |
5 |
|
|
(NA) 1998 Aug 21-23 |
61 |
33 |
6 |
|
(NA) 1994 Jul 15-17 |
48 |
46 |
6 |
|
|
(NA) 1998 Aug 20 (‡) |
60 |
30 |
10 |
|
(NA) 1994 Apr 22-24 |
56 |
40 |
4 |
|
|
(NA) 1998 Aug 18 (‡) |
64 |
29 |
7 |
|
(NA) 1994 Mar 25-27 |
52 |
42 |
6 |
|
|
(NA) 1998 Aug 10-12 |
60 |
36 |
4 |
|
(NA) 1994 Mar 7-8 |
55 |
40 |
5 |
|
|
(NA) 1998 Aug 7-8 |
60 |
35 |
5 |
|
(NA) 1994 Jan 15-17 |
57 |
36 |
7 |
|
|
(NA) 1998 Feb 13-15 |
60 |
36 |
4 |
|
1993 |
|
|
|
|
|
(NA) 1998 Jan 30-Feb 1 |
64 |
34 |
2 |
|
(NA) 1993 Nov 2-4 |
58 |
34 |
8 |
|
|
(NA) 1998 Jan 28 (‡) |
61 |
34 |
5 |
|
(NA) 1993 Sep 24-26 |
62 |
27 |
11 |
|
|
(NA) 1998 Jan 24-25 |
61 |
33 |
6 |
|
(NA) 1993 Aug 8-10 |
57 |
33 |
10 |
|
(NA) National Adults
(LV) Likely Voters
(RV) Registered Voters
(‡) Based on half sample
